GC
[ENSRNOP00000004174]
Main page
| | | Plot |
Mito |
Lyso |
|
Perox |
ER |
Golgi |
PM |
Cytosol |
Nucleus |
|
| Expt A |
 20
20
peptides |
122
spectra |
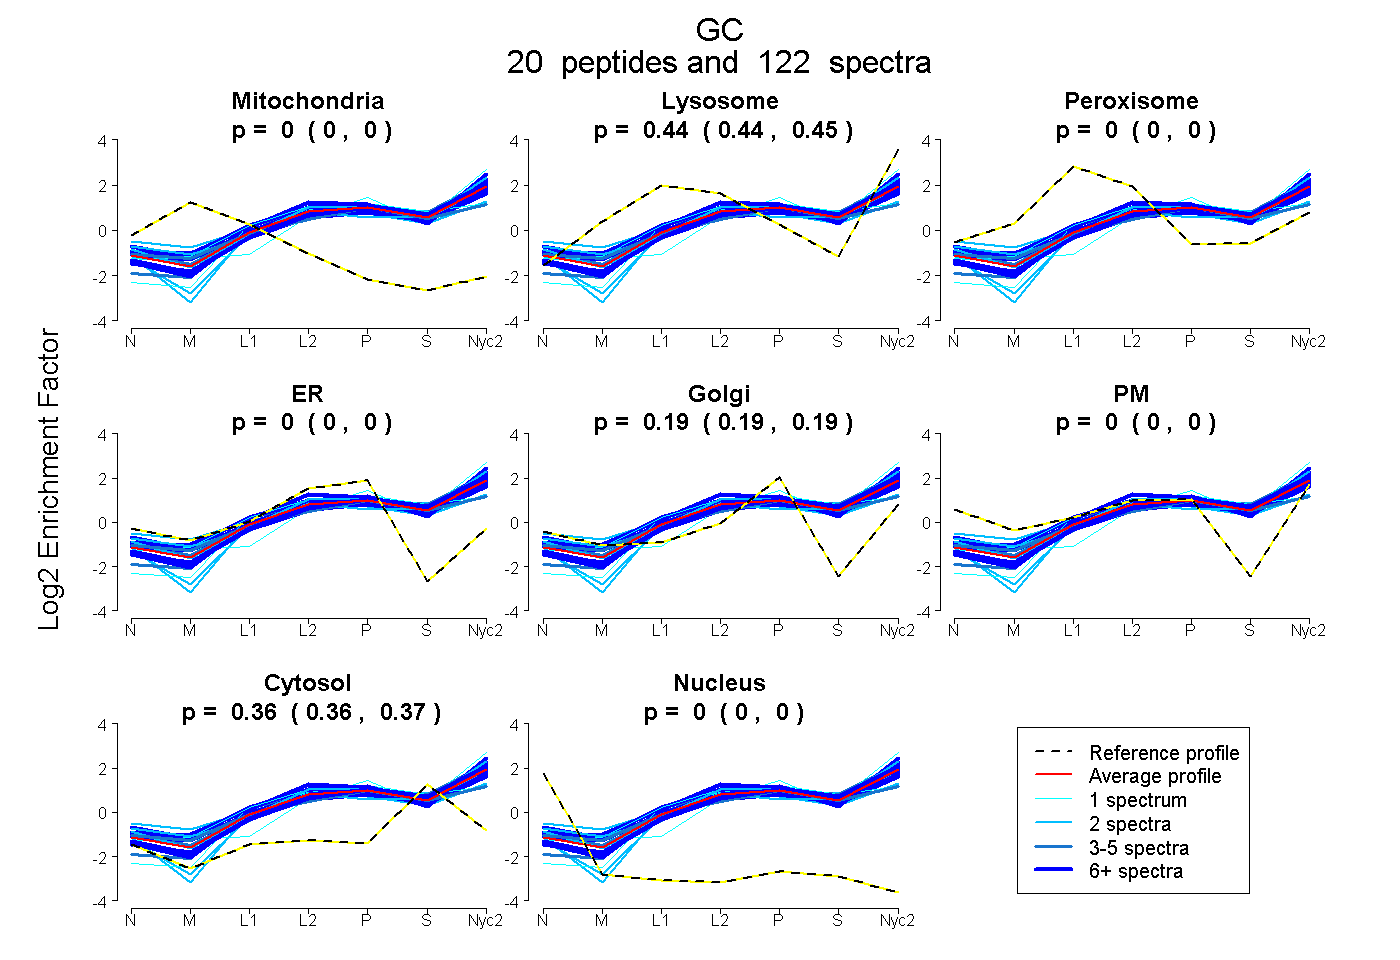 |
0.000
0.000 | 0.000 |
0.443
0.441 | 0.445 |
|
0.000
0.000 | 0.000 |
0.000
0.000 | 0.000 |
0.192
0.190 | 0.194 |
0.000
0.000 | 0.000 |
0.365
0.363 | 0.366 |
0.000
0.000 | 0.000 |
|
| | | Plot |
Mito |
|
Lyso or Perox |
|
ER |
Golgi |
PM |
Cytosol |
Nucleus |
|
| Expt B |
11
peptides |
25
spectra |
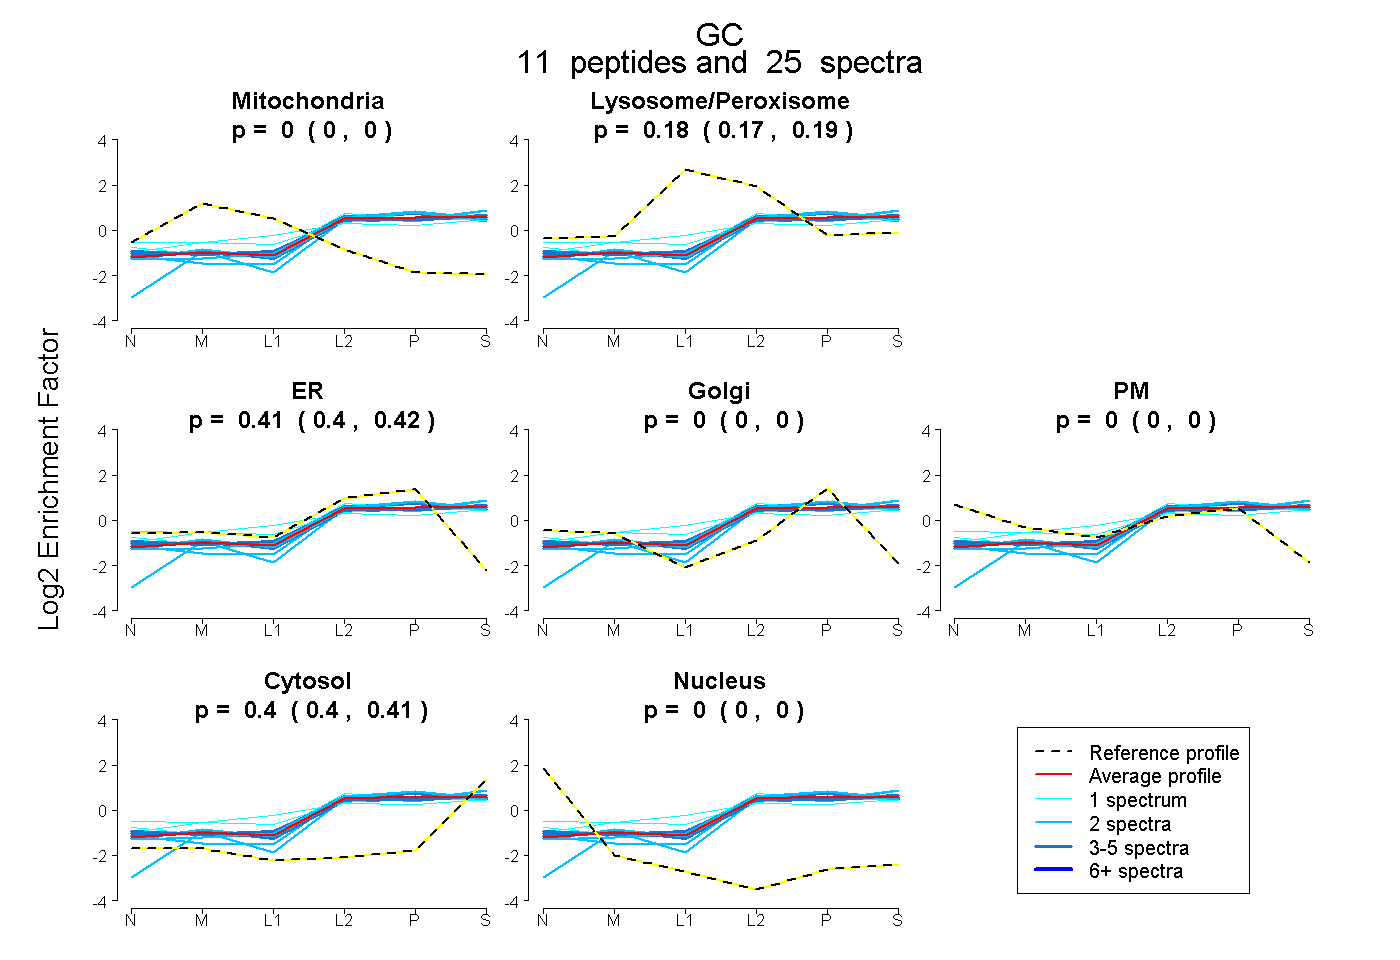 |
0.000
0.000 | 0.000 |
|
0.184
0.174 | 0.191 |
|
0.412
0.404 | 0.418 |
0.000
0.000 | 0.000 |
0.000
0.000 | 0.000 |
0.405
0.400 | 0.408 |
0.000
0.000 | 0.000 |
|
| | | Plot |
|
Lyso |
|
|
|
|
|
|
|
Other |
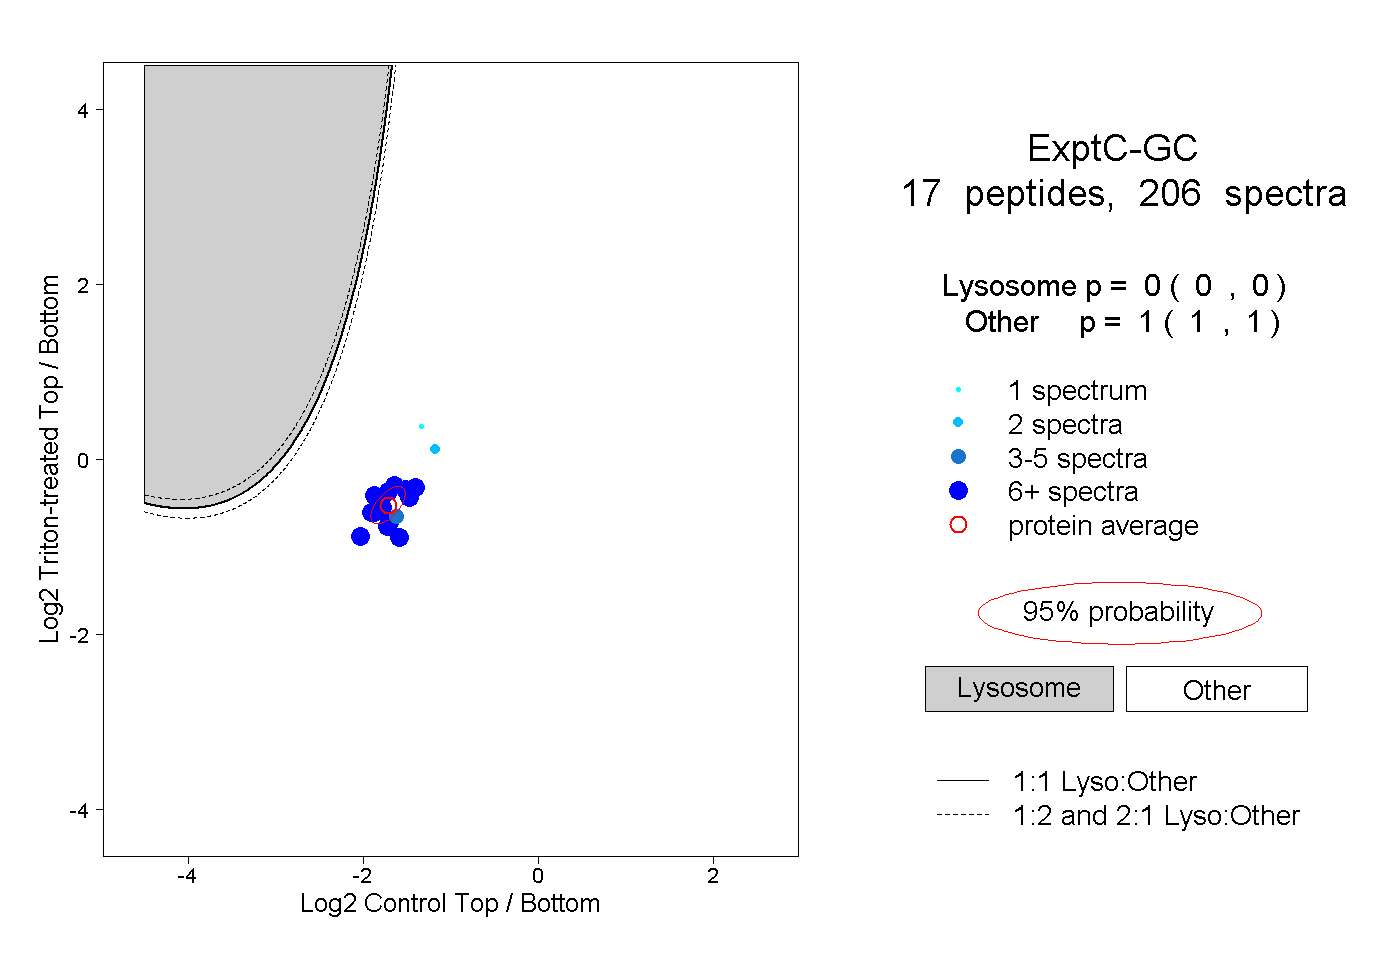
| Expt C |
17
peptides |
206
spectra |
 |
|
0.000
0.000 | 0.000 |
|
|
|
|
|
|
|
1.000
1.000 | 1.000 |
| | | Plot |
|
Lyso |
|
|
|
|
|
|
|
Other |
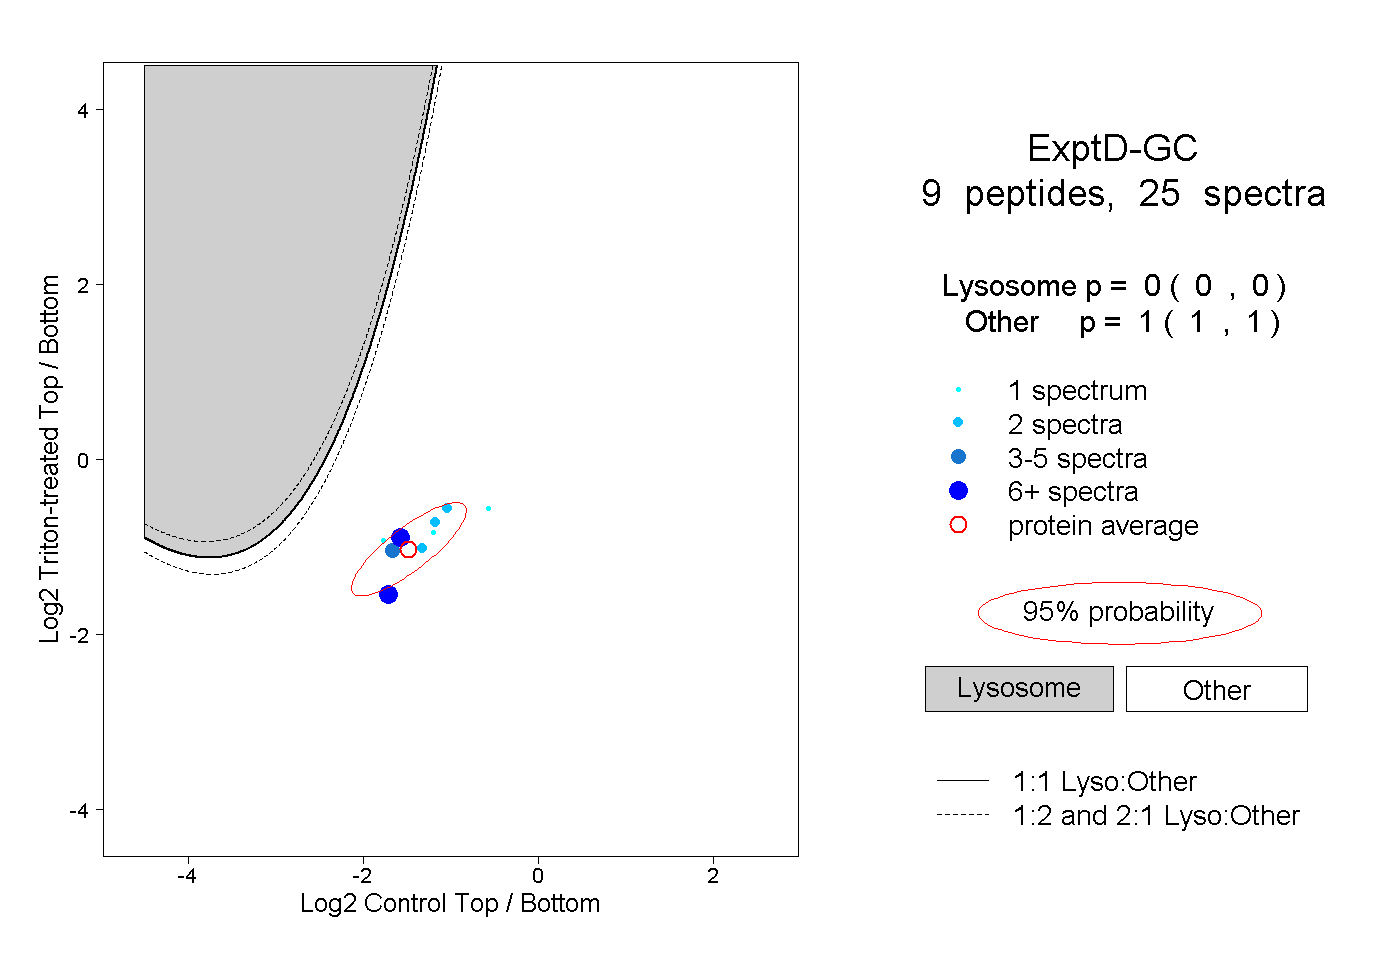
| Expt D |
9
peptides |
25
spectra |
 |
|
0.000
0.000 | 0.000 |
|
|
|
|
|
|
|
1.000
1.000 | 1.000 |
| 6 spectra, VLDTTLK |
|
0.000 |
|
|
|
|
|
|
|
1.000 |
| 2 spectra, VCSQYAAYGK |
|
0.000 |
|
|
|
|
|
|
|
1.000 |
| 1 spectrum, SLSLILYSR |
|
0.000 |
|
|
|
|
|
|
|
1.000 |
| 6 spectra, HSDFASK |
|
0.000 |
|
|
|
|
|
|
|
1.000 |
| 1 spectrum, TTDLSLK |
|
0.000 |
|
|
|
|
|
|
|
1.000 |
| 4 spectra, ICGNLSK |
|
0.000 |
|
|
|
|
|
|
|
1.000 |
| 1 spectrum, TSELSIK |
|
0.000 |
|
|
|
|
|
|
|
1.000 |
| 2 spectra, ELPEHTLK |
|
0.000 |
|
|
|
|
|
|
|
1.000 |
| 2 spectra, QLTSFIEK |
|
0.000 |
|
|
|
|
|
|
|
1.000 |