9
9peptides
spectra
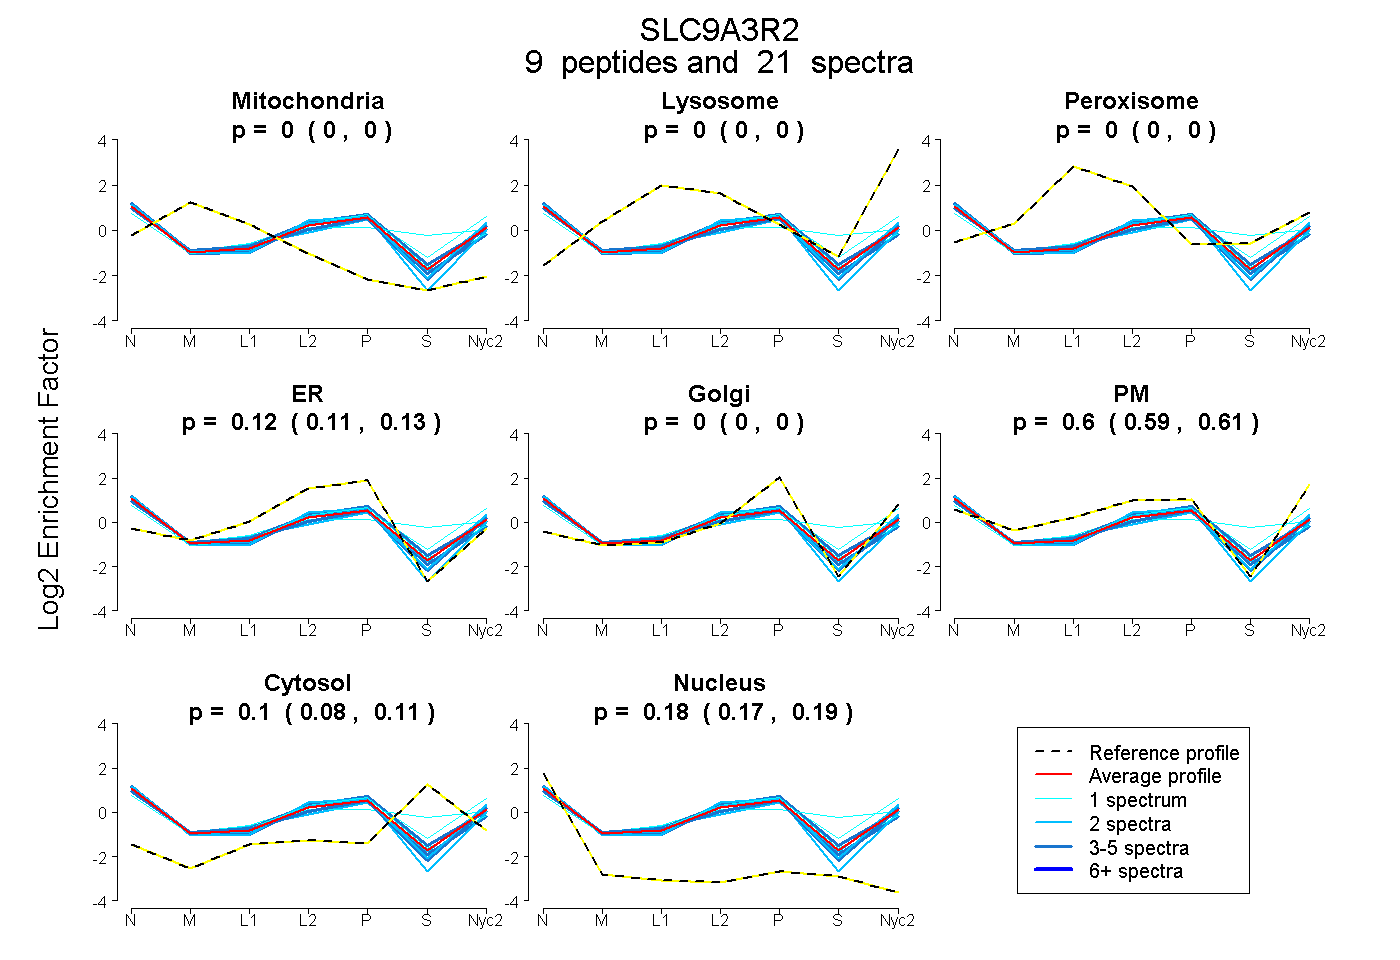
0.000 | 0.000
0.000 | 0.000
0.000 | 0.000
0.110 | 0.134
0.000 | 0.000
0.587 | 0.610
0.080 | 0.108
0.173 | 0.188
5peptides
spectra
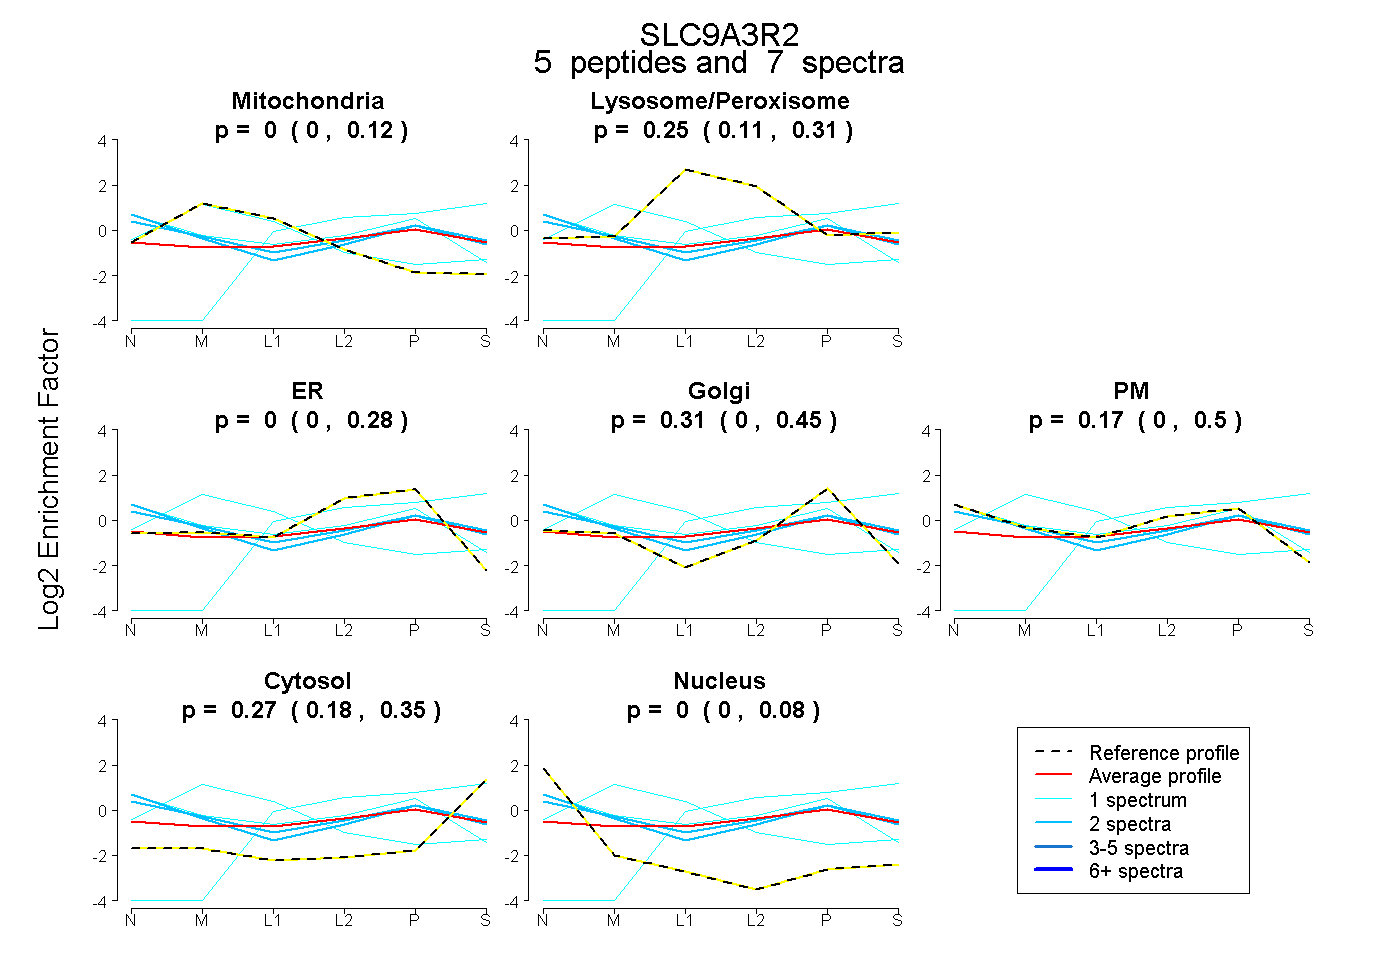
0.000 | 0.118
0.111 | 0.314
0.000 | 0.282
0.000 | 0.446
0.000 | 0.504
0.176 | 0.348
0.000 | 0.076