 6
6peptides
spectra
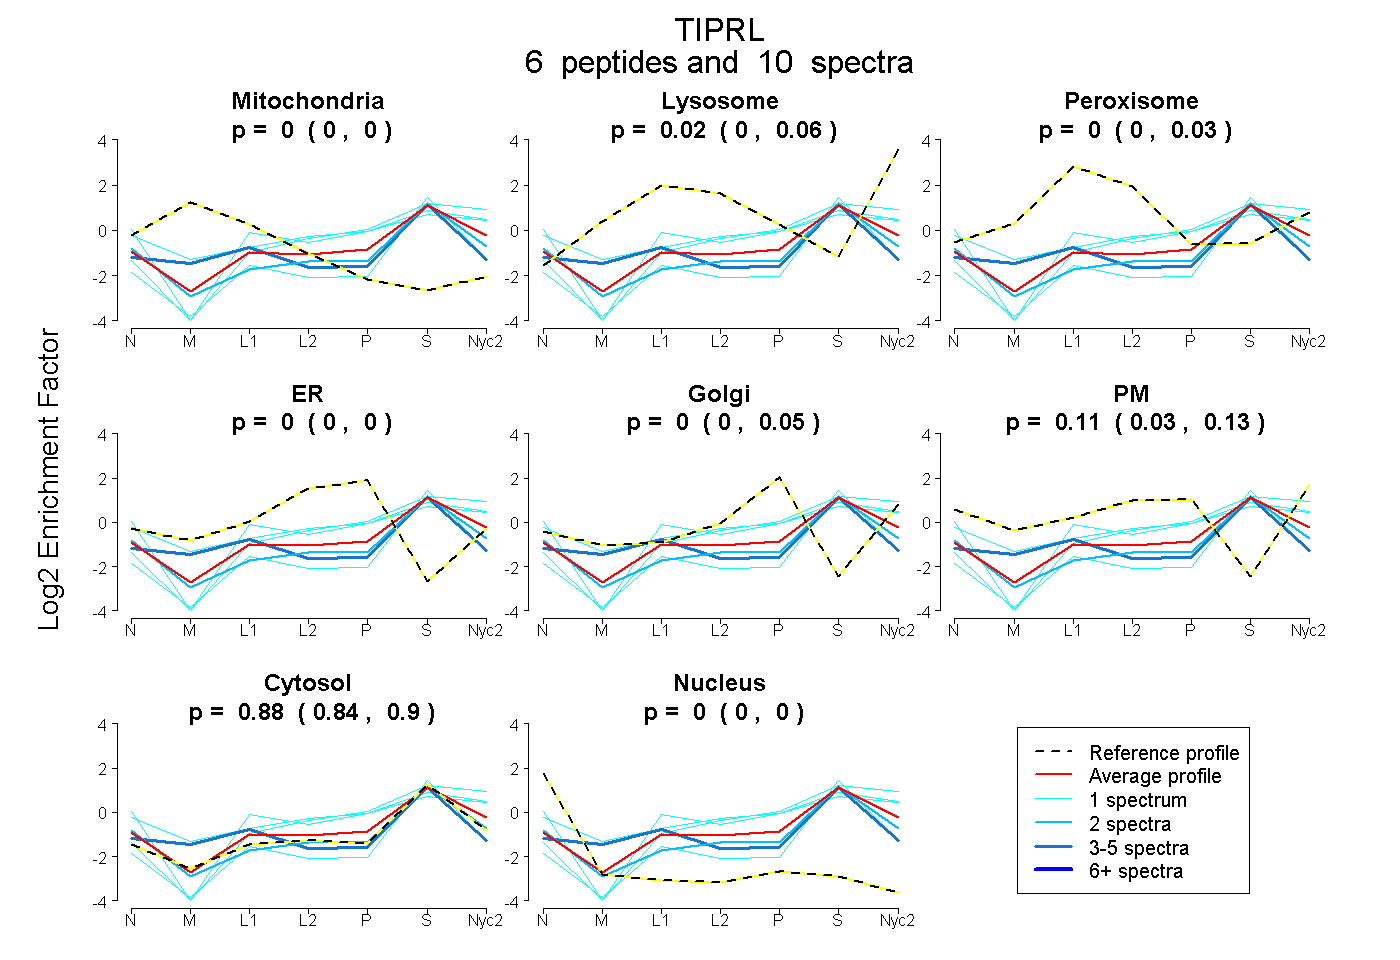
0.000 | 0.000
0.000 | 0.058
0.000 | 0.028
0.000 | 0.000
0.000 | 0.052
0.029 | 0.126
0.844 | 0.900
0.000 | 0.000
| Plot | Mito | Lyso | Perox | ER | Golgi | PM | Cytosol | Nucleus | |||||
| Expt A |
6 peptides |
10 spectra |
|
0.000 0.000 | 0.000 |
0.016 0.000 | 0.058 |
0.000 0.000 | 0.028 |
0.000 0.000 | 0.000 |
0.000 0.000 | 0.052 |
0.106 0.029 | 0.126 |
0.878 0.844 | 0.900 |
0.000 0.000 | 0.000 |
| 2 spectra, VVPTTDHIDTEK | 0.000 | 0.000 | 0.000 | 0.000 | 0.000 | 0.001 | 0.936 | 0.062 | ||
| 1 spectrum, LADELHMPSLPEMMFGDNVLR | 0.000 | 0.051 | 0.029 | 0.000 | 0.000 | 0.324 | 0.596 | 0.000 | ||
| 4 spectra, VACAEEWQESR | 0.186 | 0.000 | 0.000 | 0.000 | 0.000 | 0.000 | 0.814 | 0.000 | ||
| 1 spectrum, SADVEK | 0.000 | 0.127 | 0.000 | 0.000 | 0.099 | 0.000 | 0.774 | 0.000 | ||
| 1 spectrum, GTLLGESLK | 0.000 | 0.000 | 0.000 | 0.000 | 0.000 | 0.274 | 0.726 | 0.000 | ||
| 1 spectrum, EVIKPYDWTYTTDYK | 0.000 | 0.000 | 0.000 | 0.000 | 0.000 | 0.000 | 0.955 | 0.045 |
| Plot | Lyso | Other | |||||||||||
| Expt C |
3 peptides |
7 spectra |
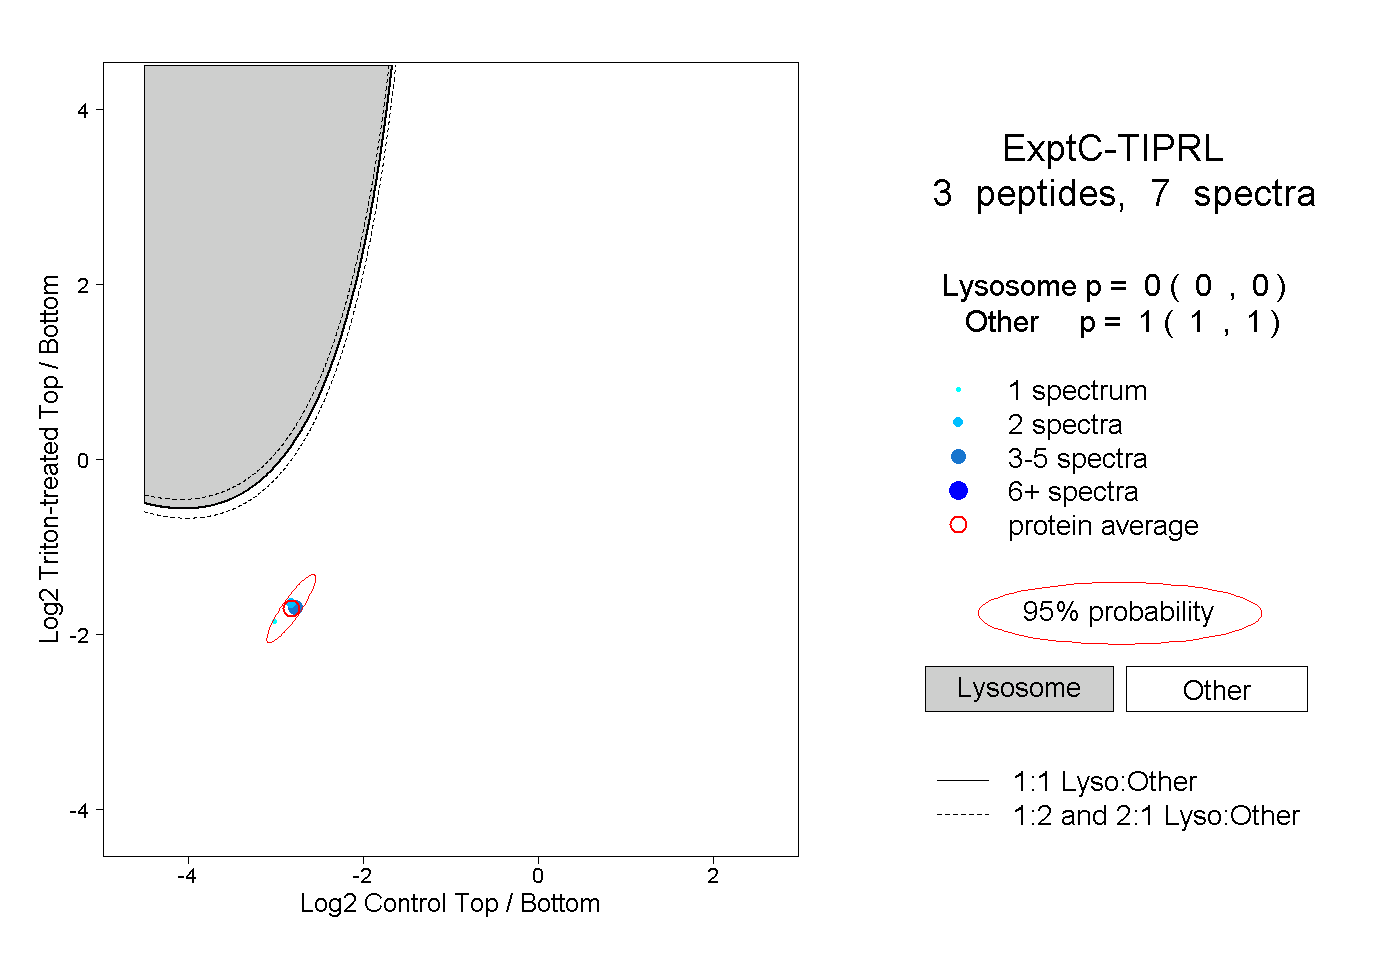 |
0.000 0.000 | 0.000 |
1.000 1.000 | 1.000 |