 5
5peptides
spectra
0.000 | 0.100
0.000 | 0.000
0.000 | 0.181
0.000 | 0.000
0.000 | 0.000
0.240 | 0.363
0.299 | 0.375
0.155 | 0.247
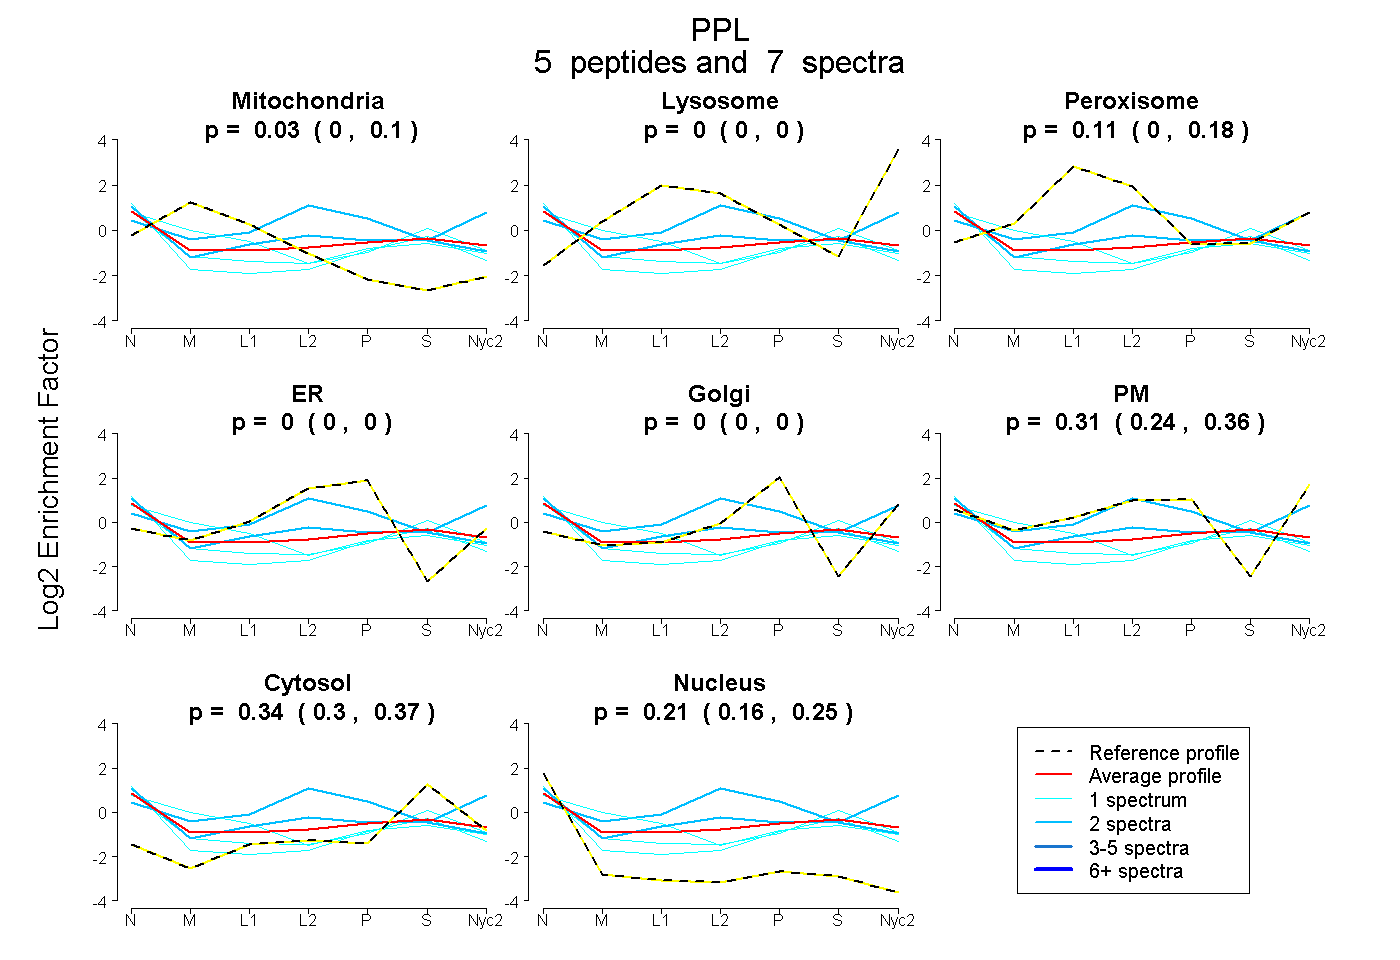
| Plot | Mito | Lyso | Perox | ER | Golgi | PM | Cytosol | Nucleus | |||||
| Expt A |
5 peptides |
7 spectra |
|
0.032 0.000 | 0.100 |
0.000 0.000 | 0.000 |
0.110 0.000 | 0.181 |
0.000 0.000 | 0.000 |
0.000 0.000 | 0.000 |
0.308 0.240 | 0.363 |
0.338 0.299 | 0.375 |
0.212 0.155 | 0.247 |
| 1 spectrum, NLLDEIASMEQGAQK | 0.373 | 0.000 | 0.000 | 0.000 | 0.000 | 0.225 | 0.304 | 0.098 | ||
| 2 spectra, LQEEHQR | 0.000 | 0.000 | 0.189 | 0.024 | 0.000 | 0.548 | 0.239 | 0.000 | ||
| 1 spectrum, LQALEQETR | 0.064 | 0.000 | 0.007 | 0.000 | 0.000 | 0.228 | 0.483 | 0.218 | ||
| 2 spectra, VVLQQDPQQTR | 0.000 | 0.000 | 0.224 | 0.051 | 0.000 | 0.212 | 0.249 | 0.264 | ||
| 1 spectrum, DYELEAEK | 0.000 | 0.000 | 0.000 | 0.000 | 0.000 | 0.221 | 0.411 | 0.368 |
| Plot | Mito | Lyso or Perox | ER | Golgi | PM | Cytosol | Nucleus | ||||||
| Expt B |
1 peptide |
1 spectrum |
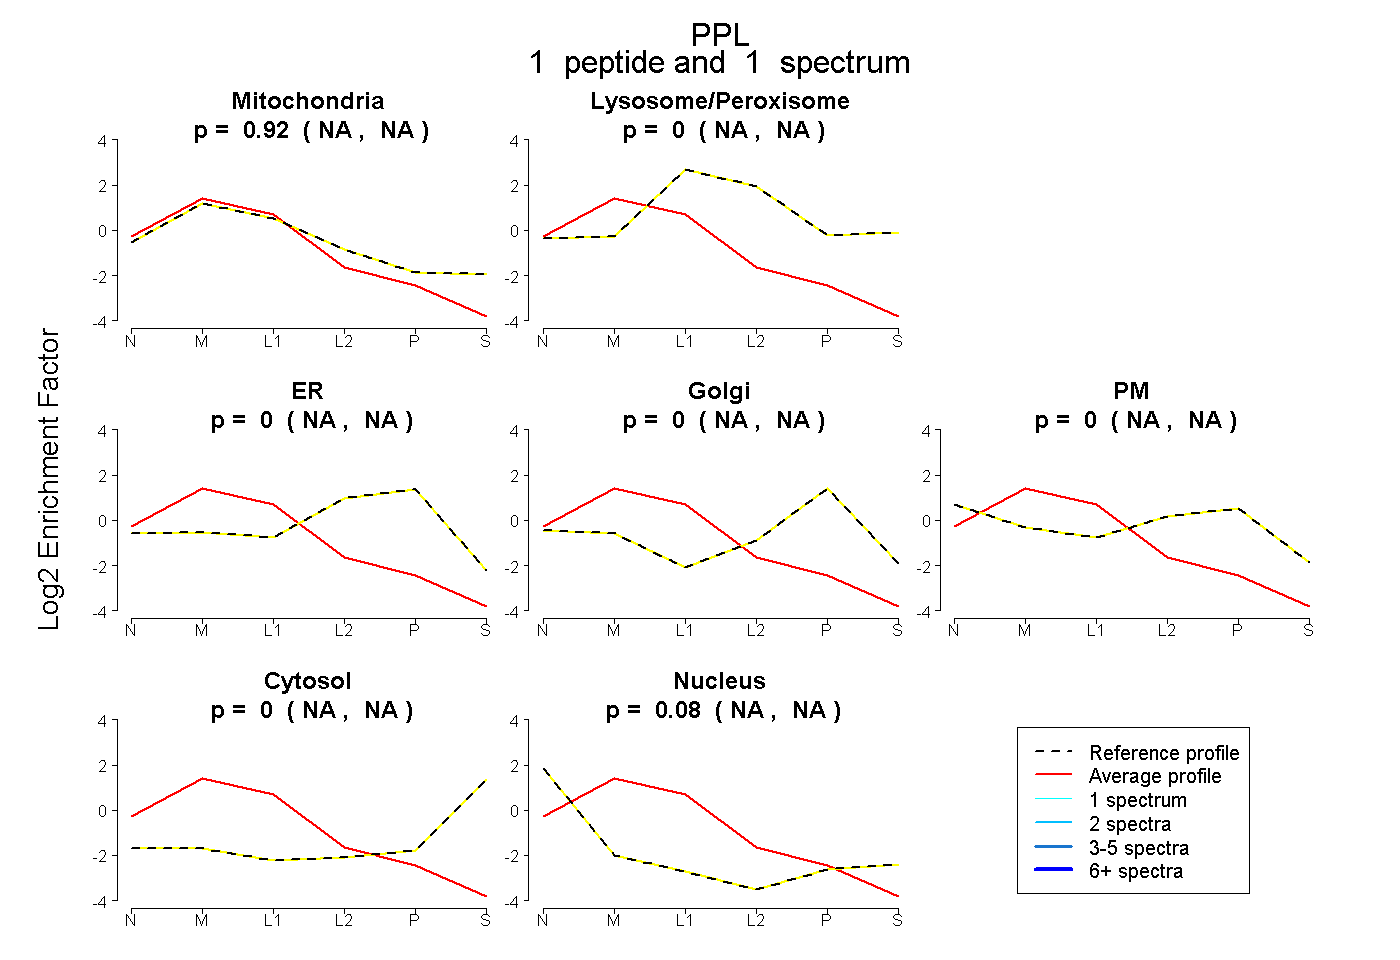 |
0.918 NA | NA |
0.000 NA | NA |
0.000 NA | NA |
0.000 NA | NA |
0.000 NA | NA |
0.000 NA | NA |
0.082 NA | NA |
|||
| Plot | Lyso | Other | |||||||||||
| Expt D |
1 peptide |
1 spectrum |
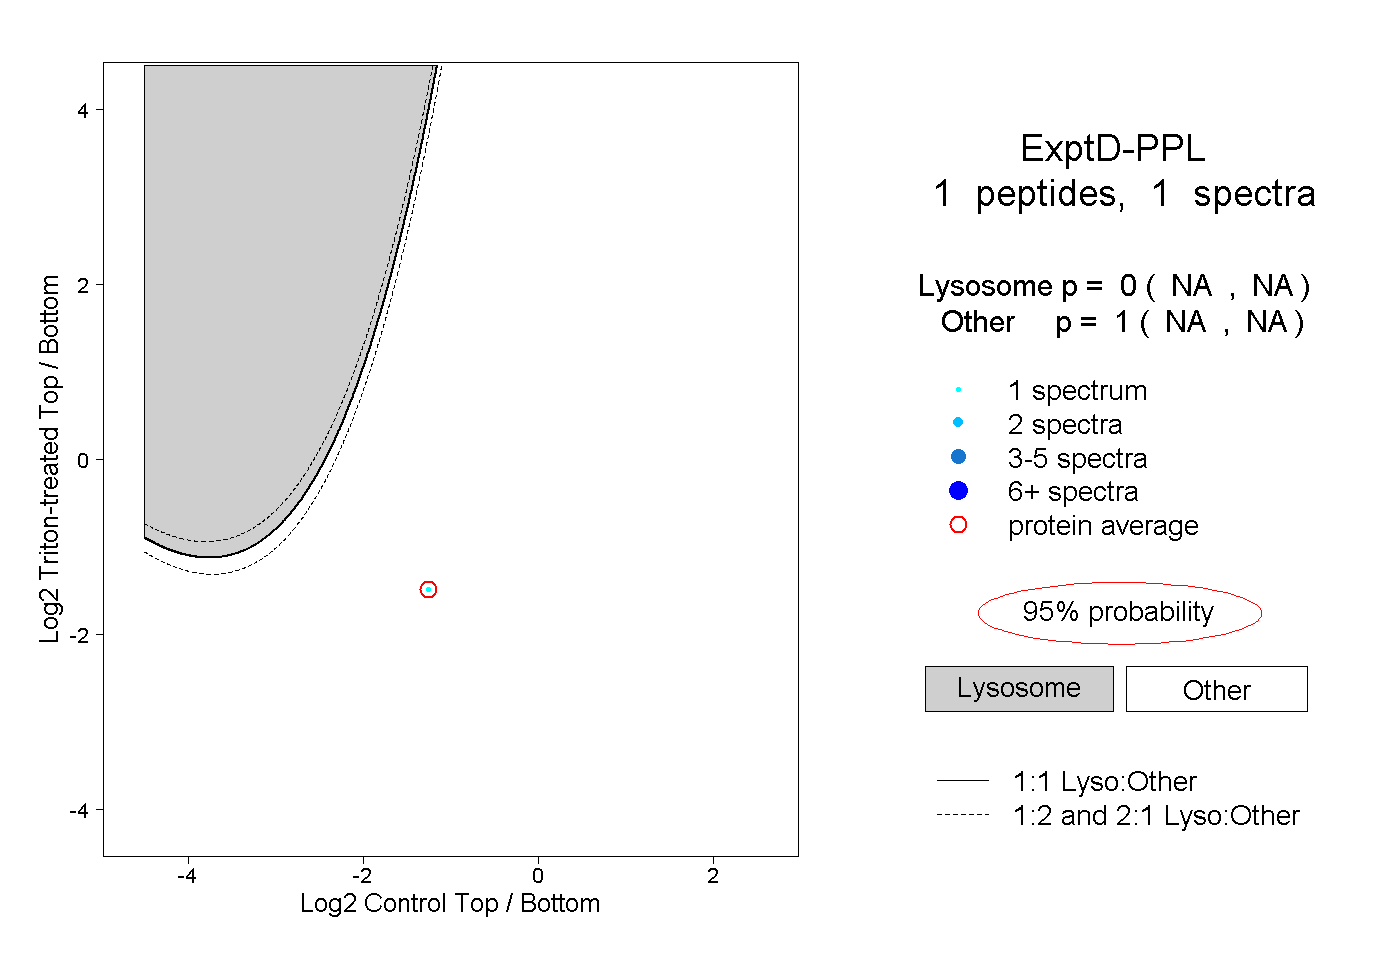 |
0.000 NA | NA |
1.000 NA | NA |