 6
6peptides
spectra
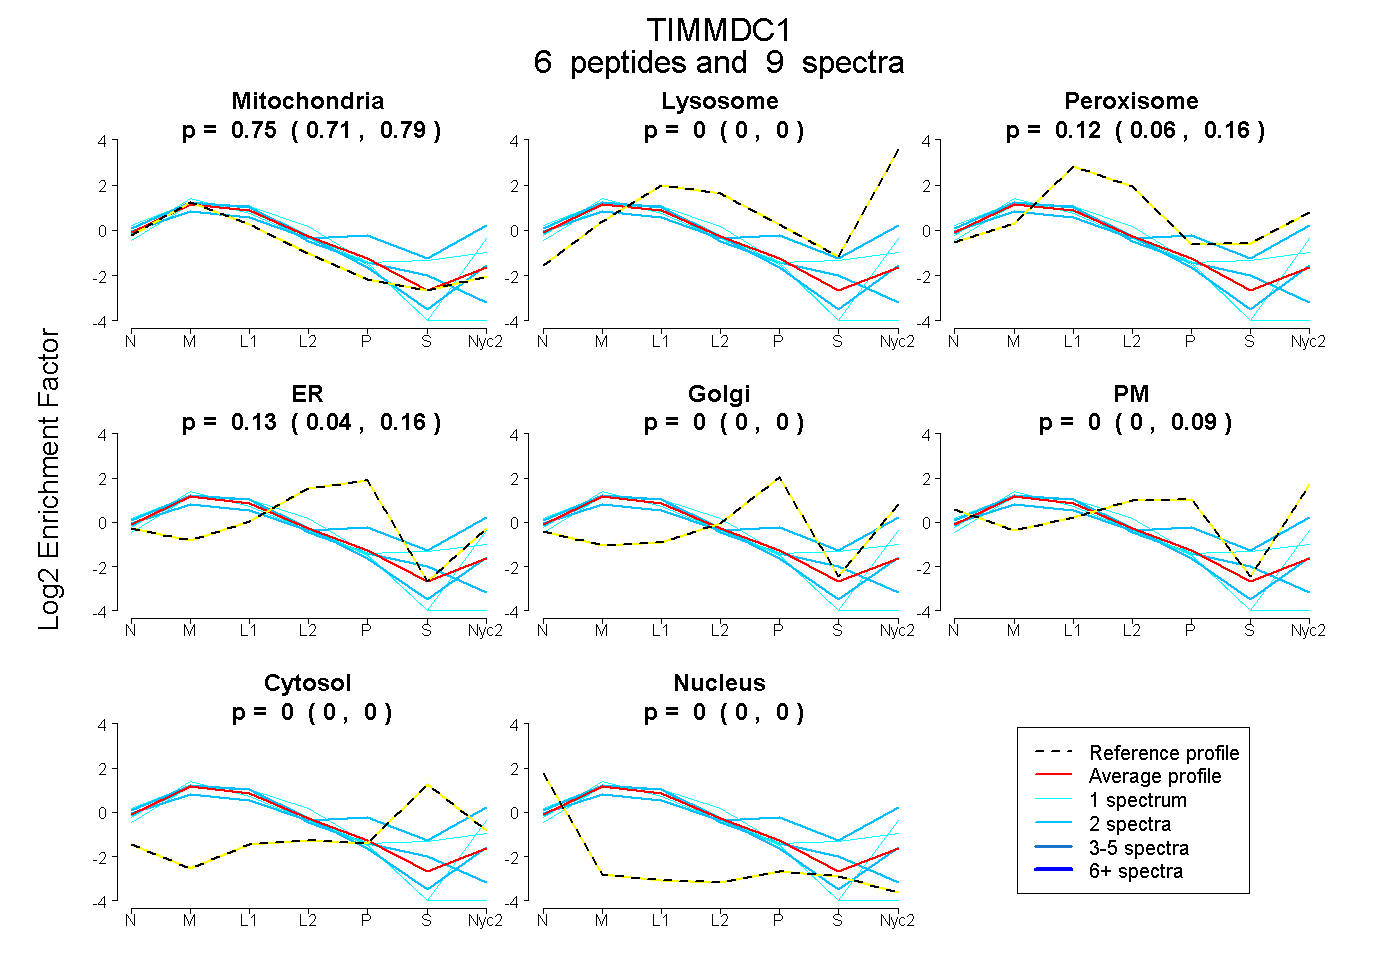
0.707 | 0.789
0.000 | 0.000
0.058 | 0.163
0.043 | 0.161
0.000 | 0.000
0.000 | 0.087
0.000 | 0.000
0.000 | 0.000
7peptides
spectra
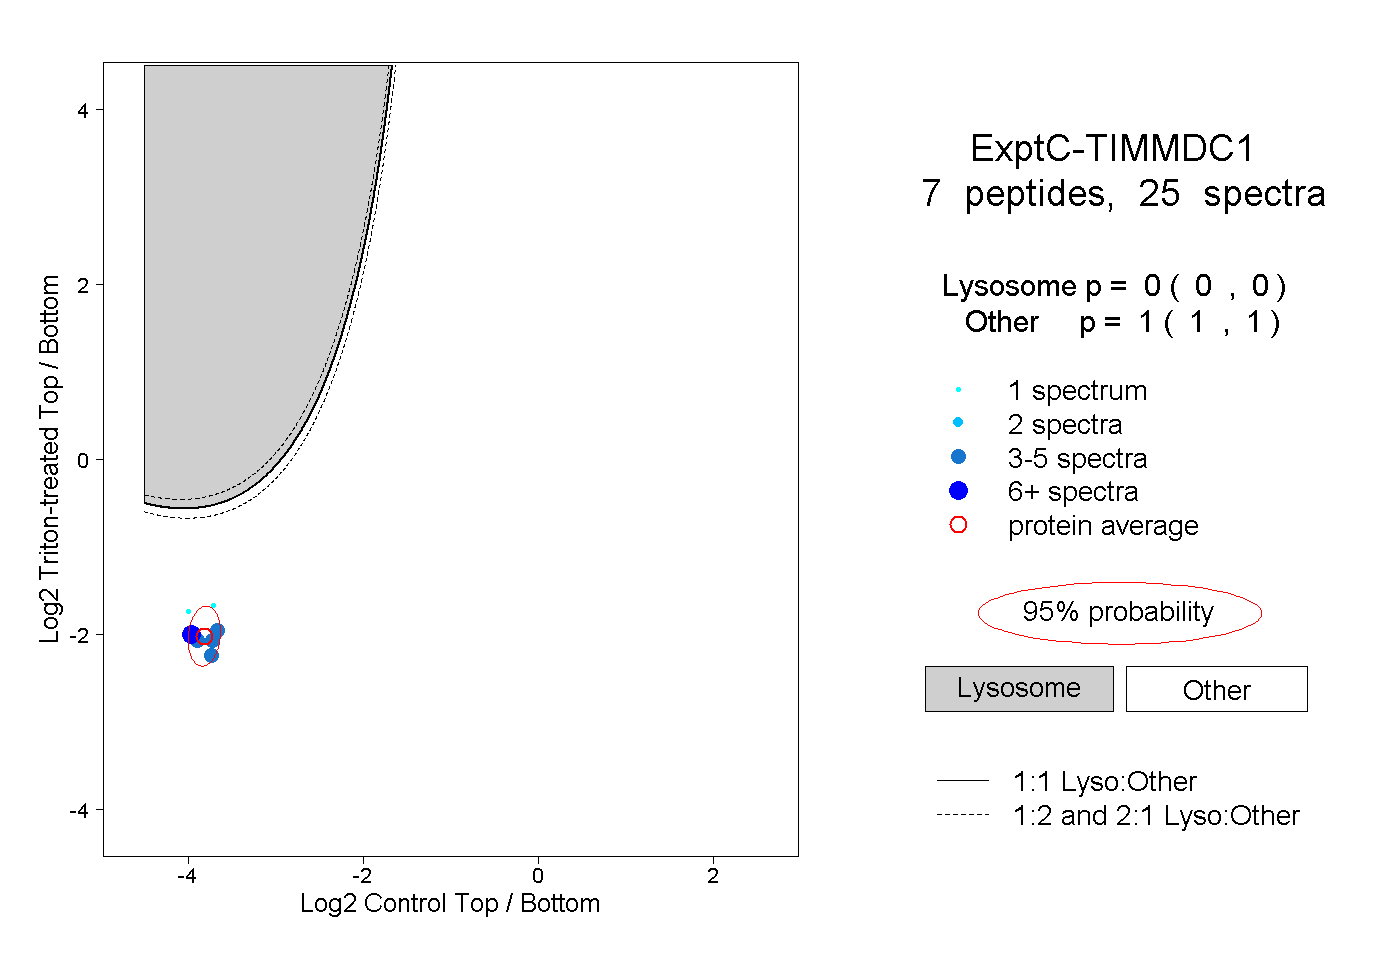
0.000 | 0.000
1.000 | 1.000
1peptide
spectrum
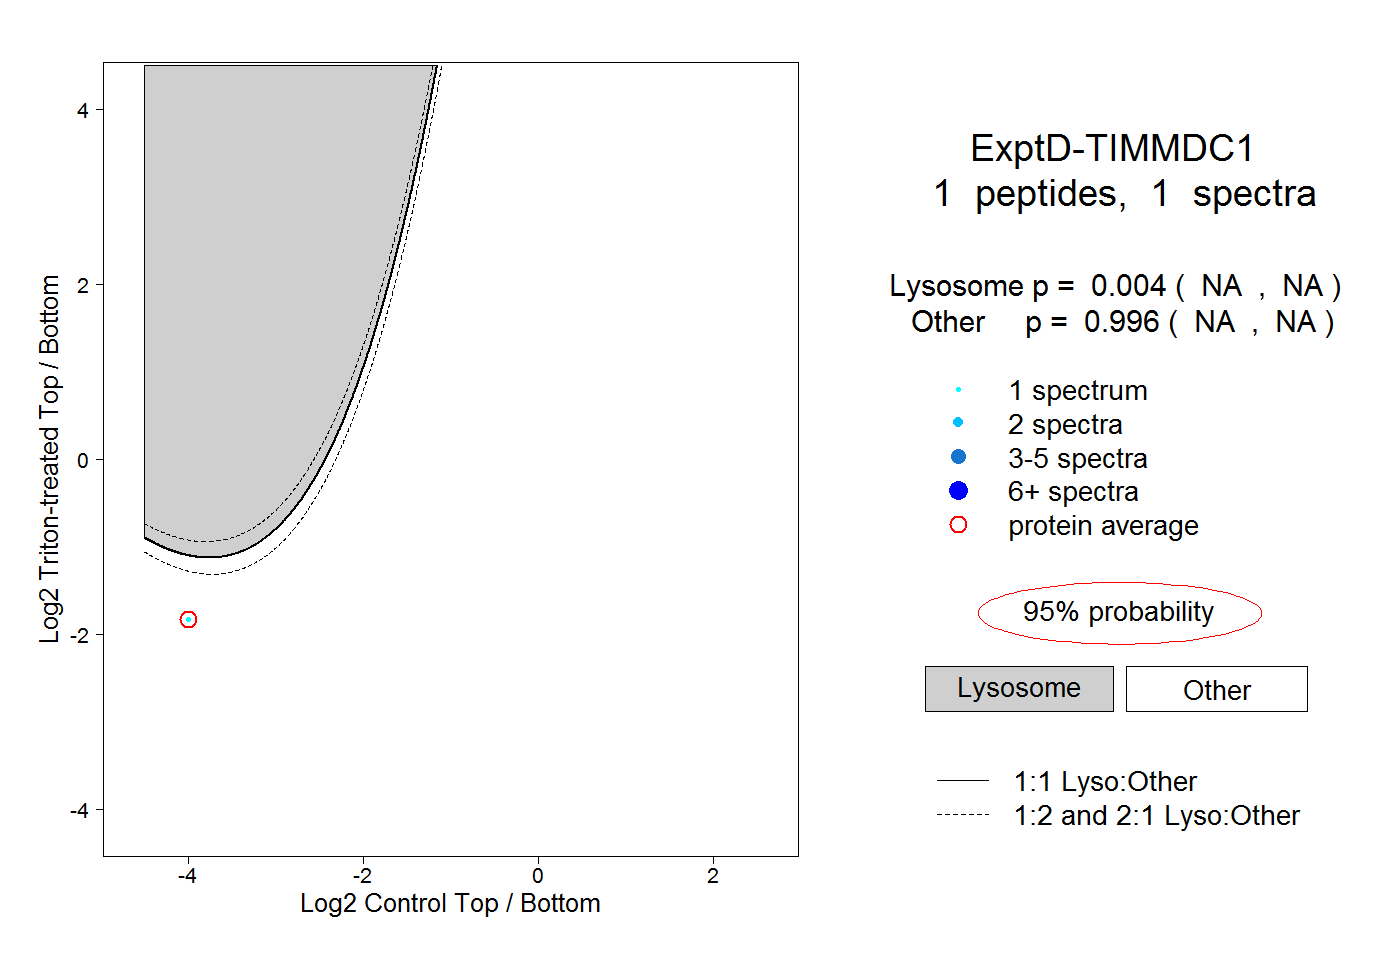
NA | NA
NA | NA