 23
23peptides
spectra
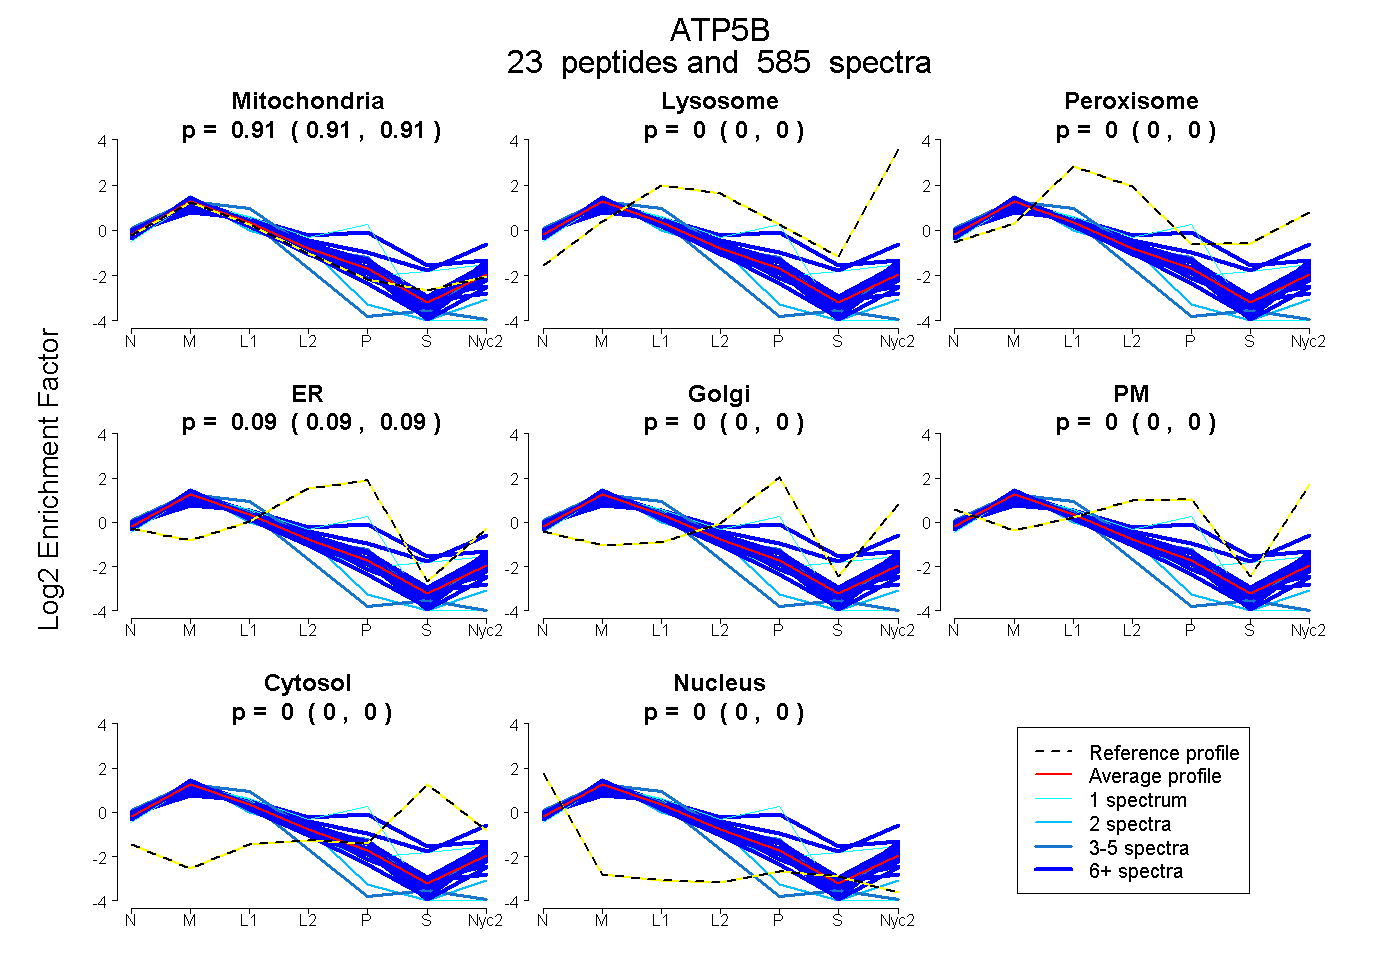
0.911 | 0.914
0.000 | 0.000
0.000 | 0.000
0.086 | 0.089
0.000 | 0.000
0.000 | 0.000
0.000 | 0.000
0.000 | 0.000
19peptides
spectra
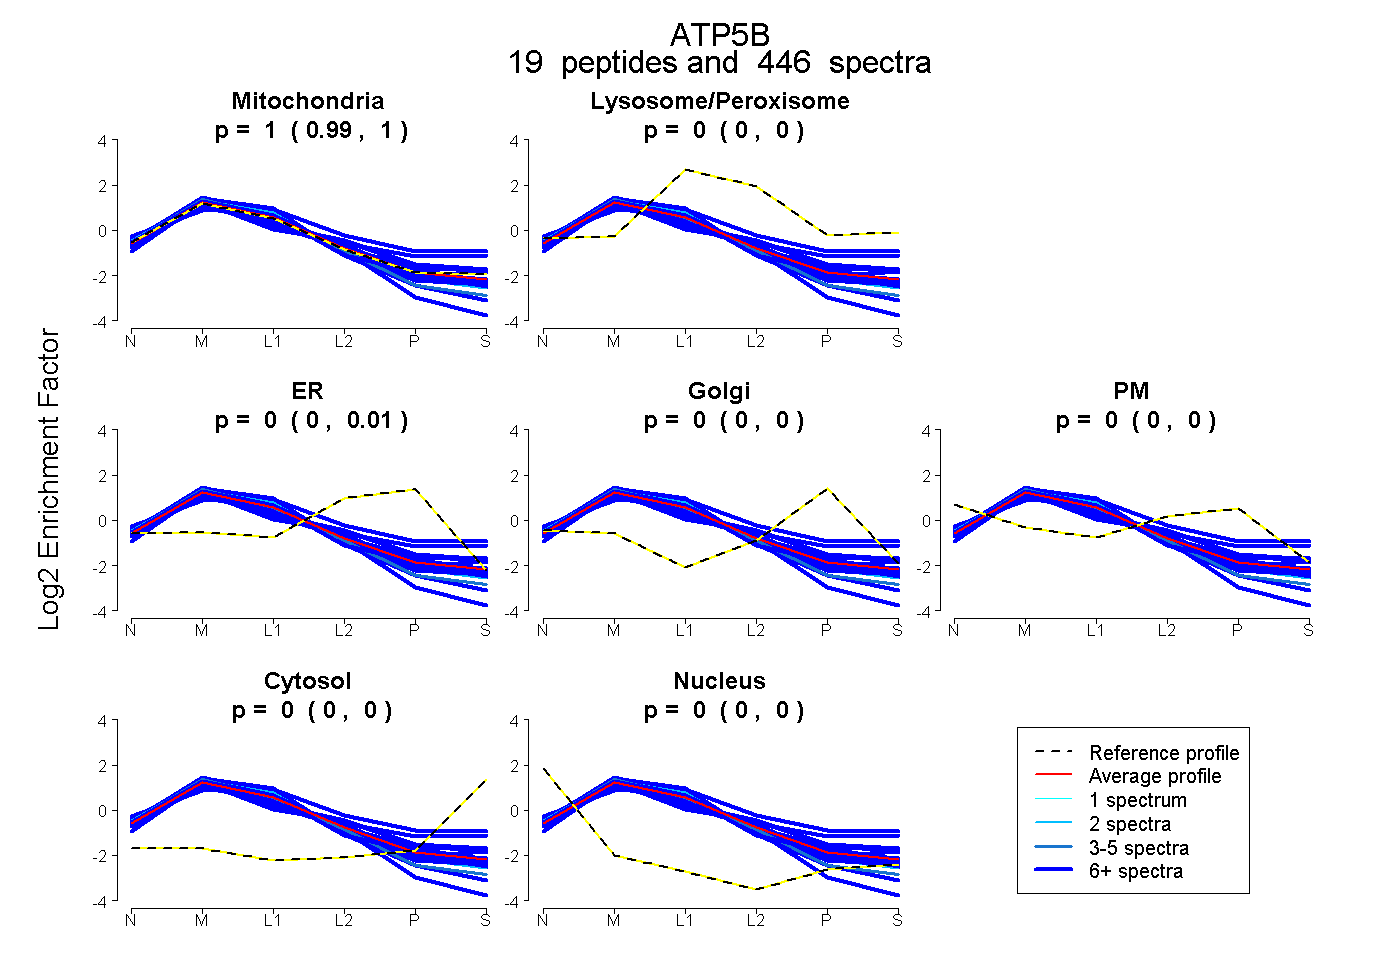
0.994 | 0.997
0.000 | 0.000
0.003 | 0.006
0.000 | 0.000
0.000 | 0.000
0.000 | 0.000
0.000 | 0.000
24peptides
spectra
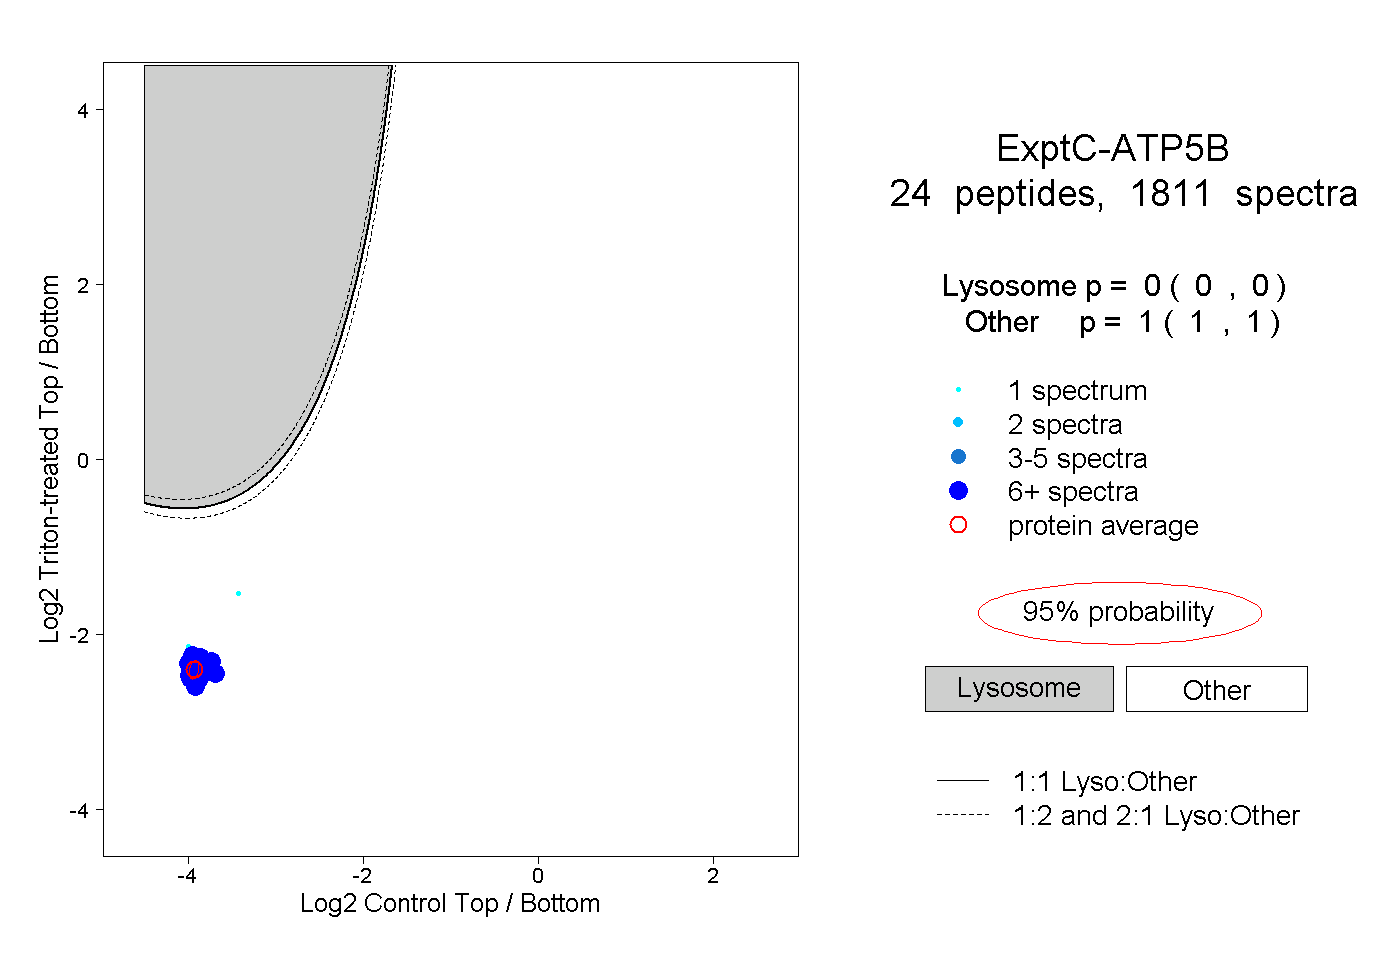
0.000 | 0.000
1.000 | 1.000
14peptides
spectra
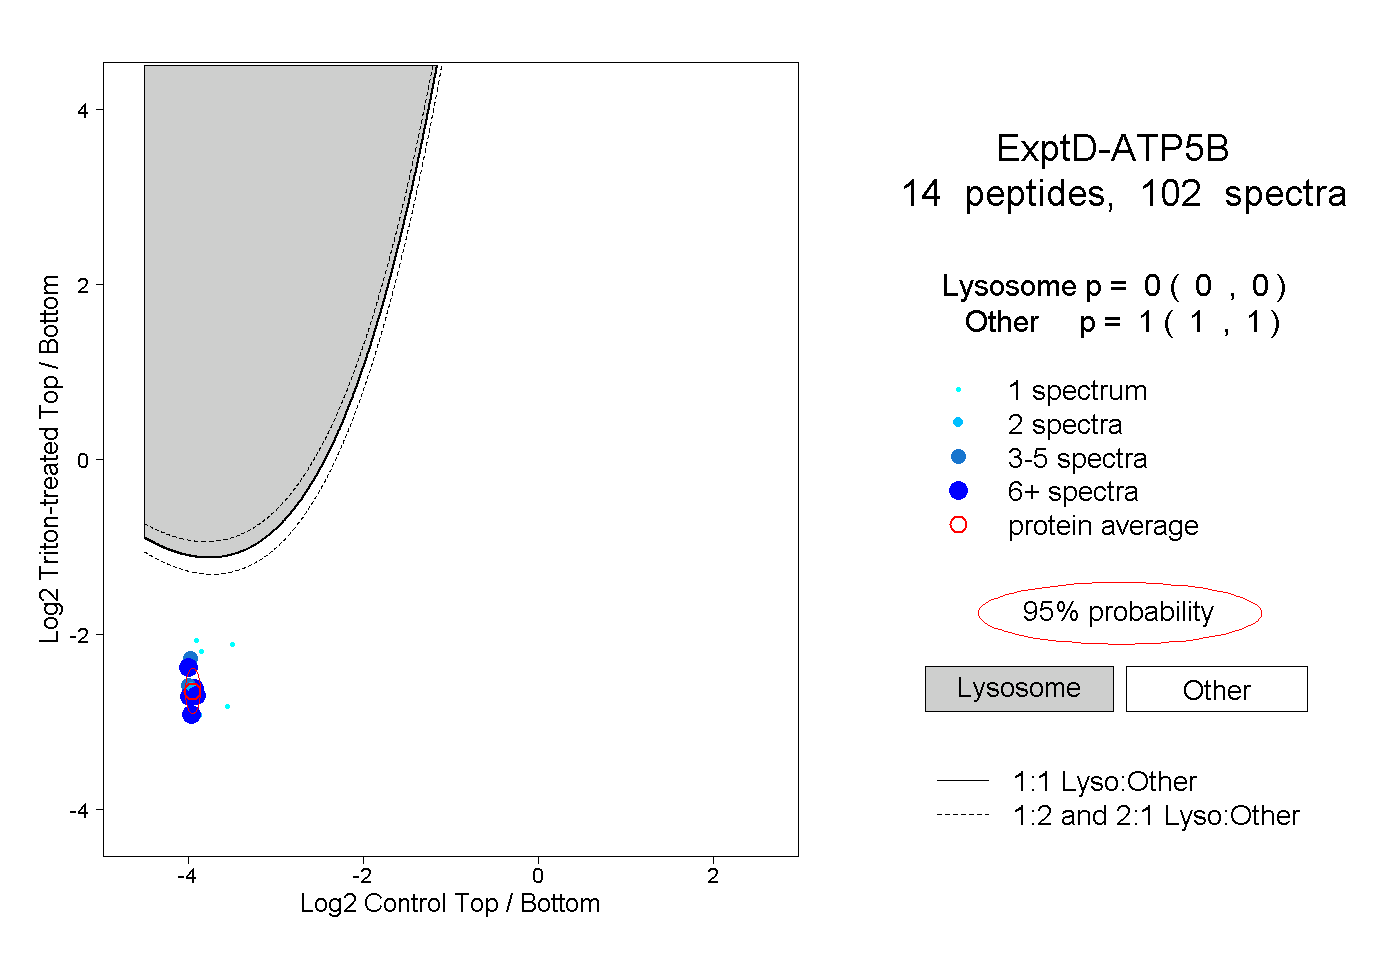
0.000 | 0.000
1.000 | 1.000