 8
8peptides
spectra
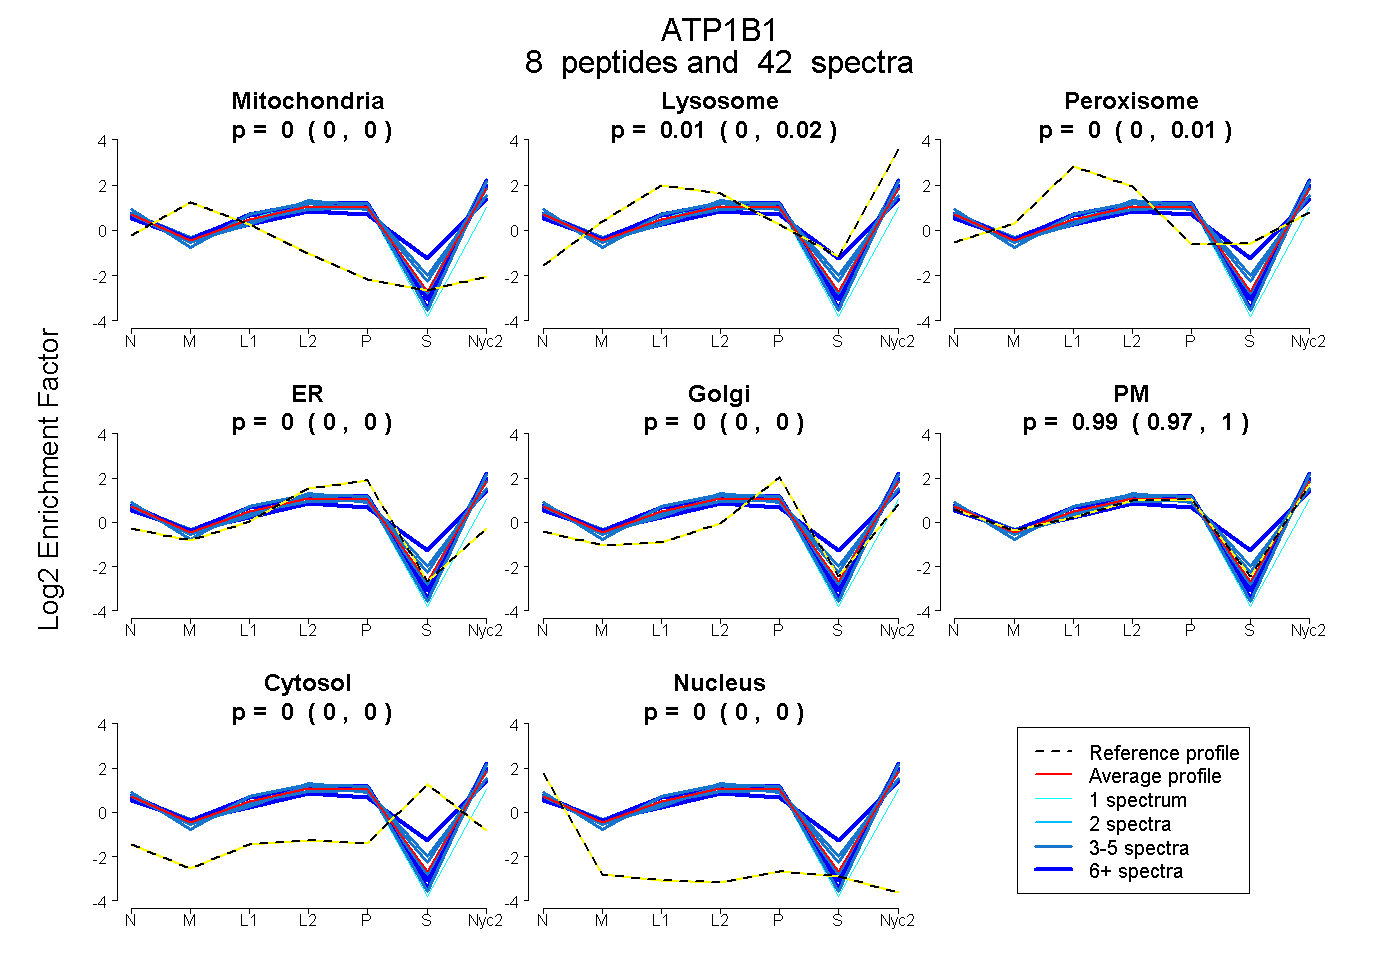
0.000 | 0.000
0.002 | 0.022
0.000 | 0.006
0.000 | 0.000
0.000 | 0.000
0.974 | 0.996
0.000 | 0.000
0.000 | 0.000
5peptides
spectra
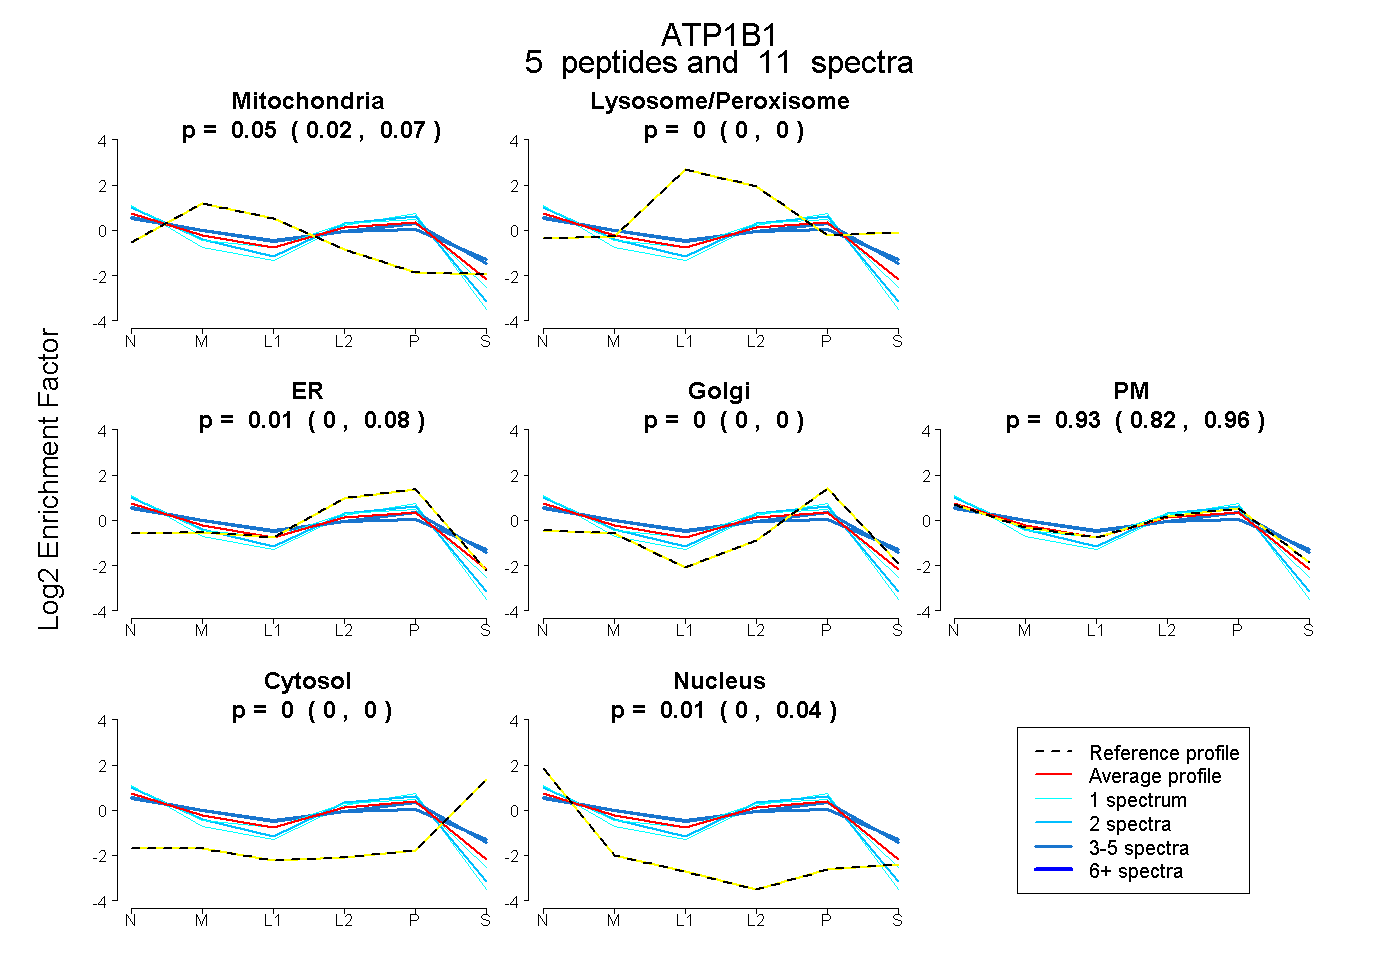
0.023 | 0.066
0.000 | 0.000
0.000 | 0.083
0.000 | 0.000
0.820 | 0.958
0.000 | 0.000
0.000 | 0.035
9peptides
spectra
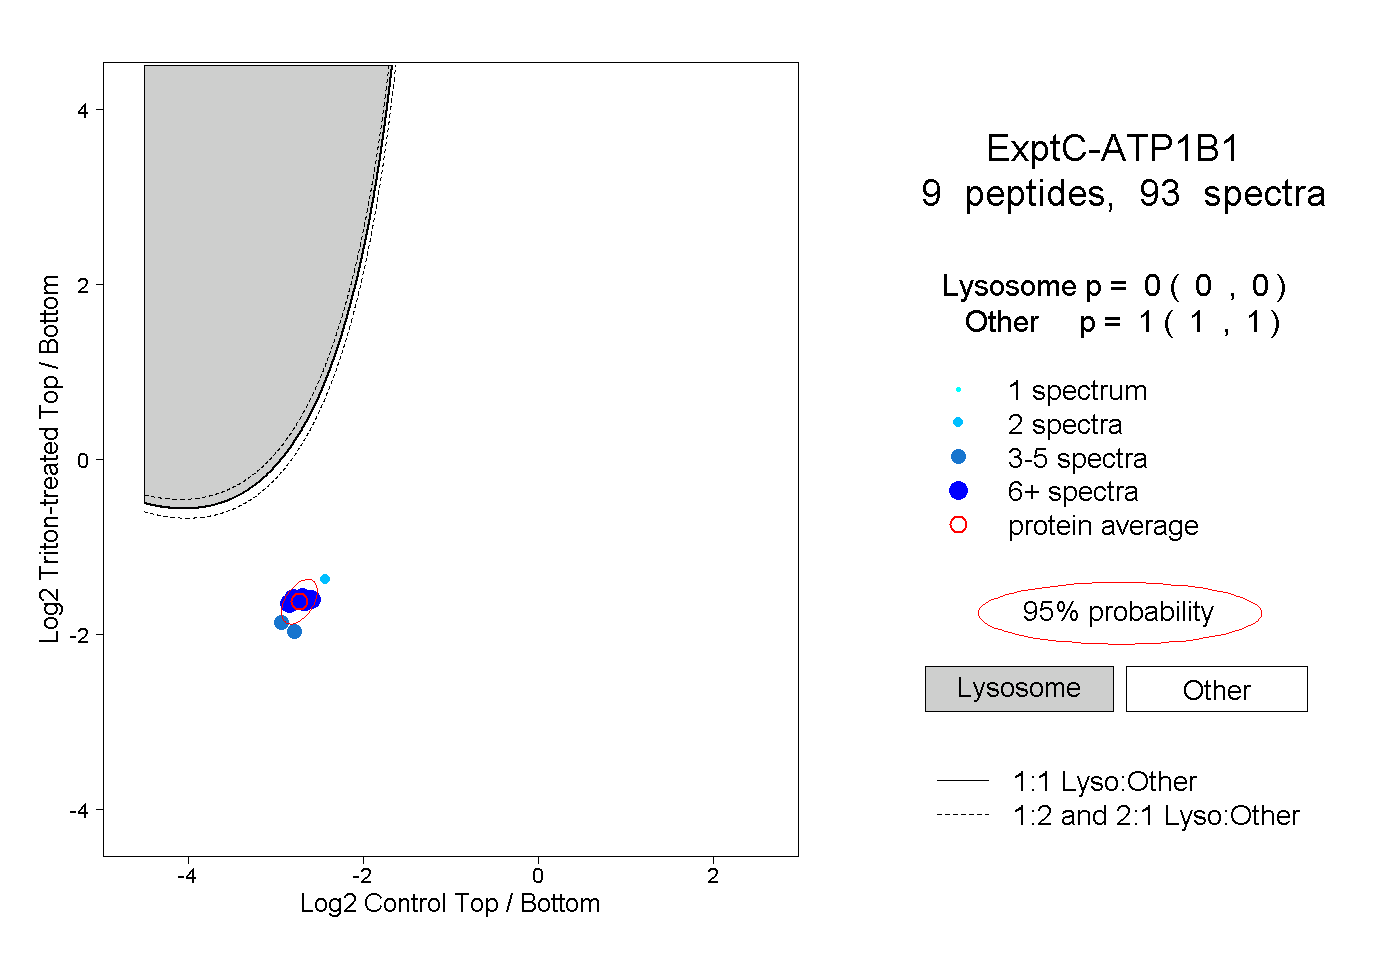
0.000 | 0.000
1.000 | 1.000
5peptides
spectra
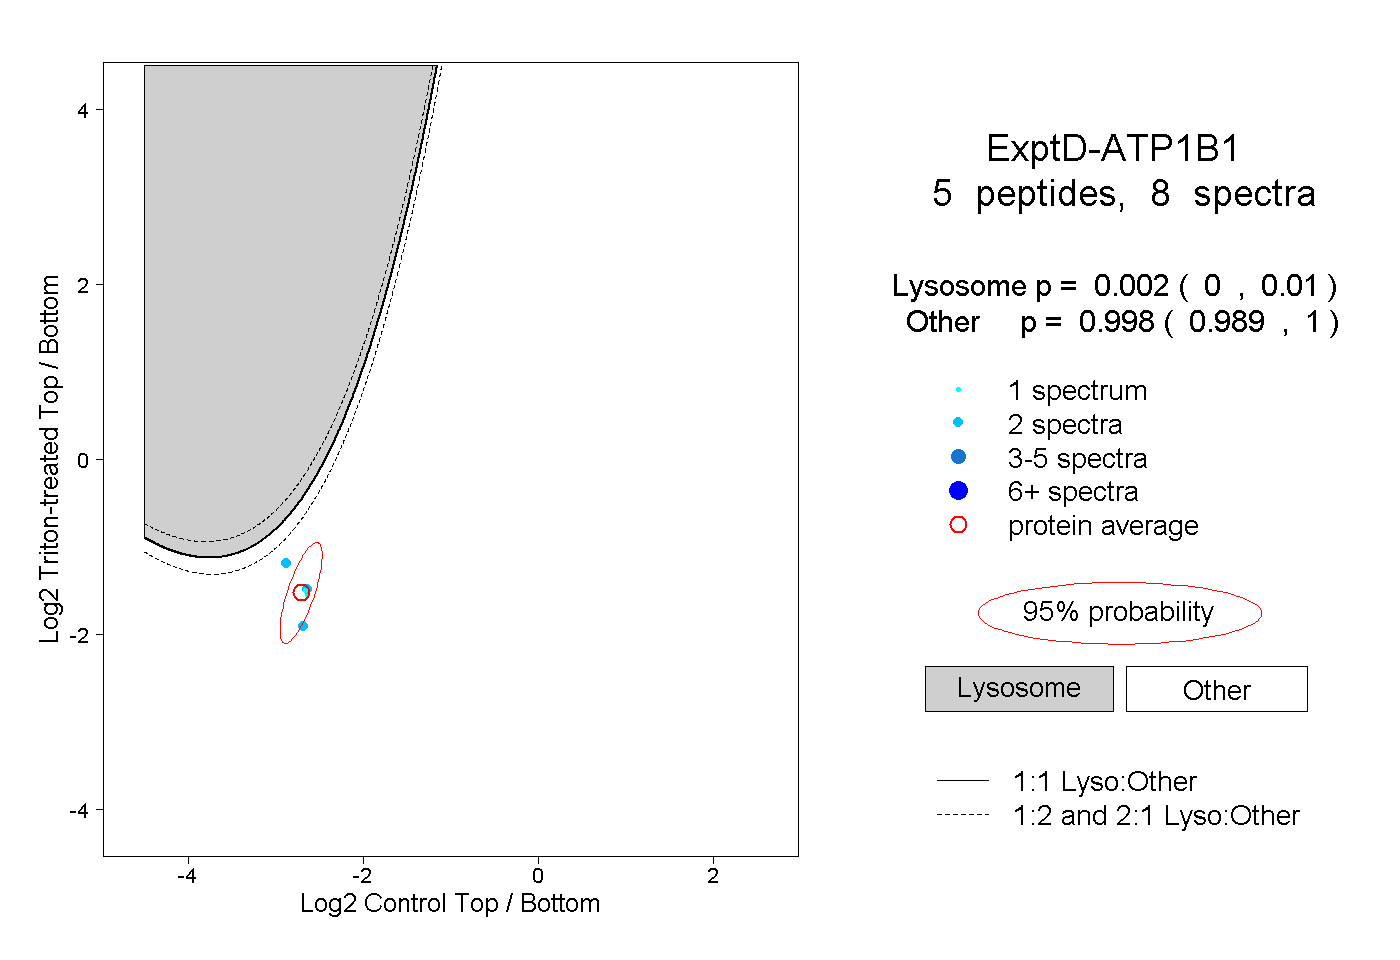
0.000 | 0.010
0.989 | 1.000