 2
2peptides
spectra
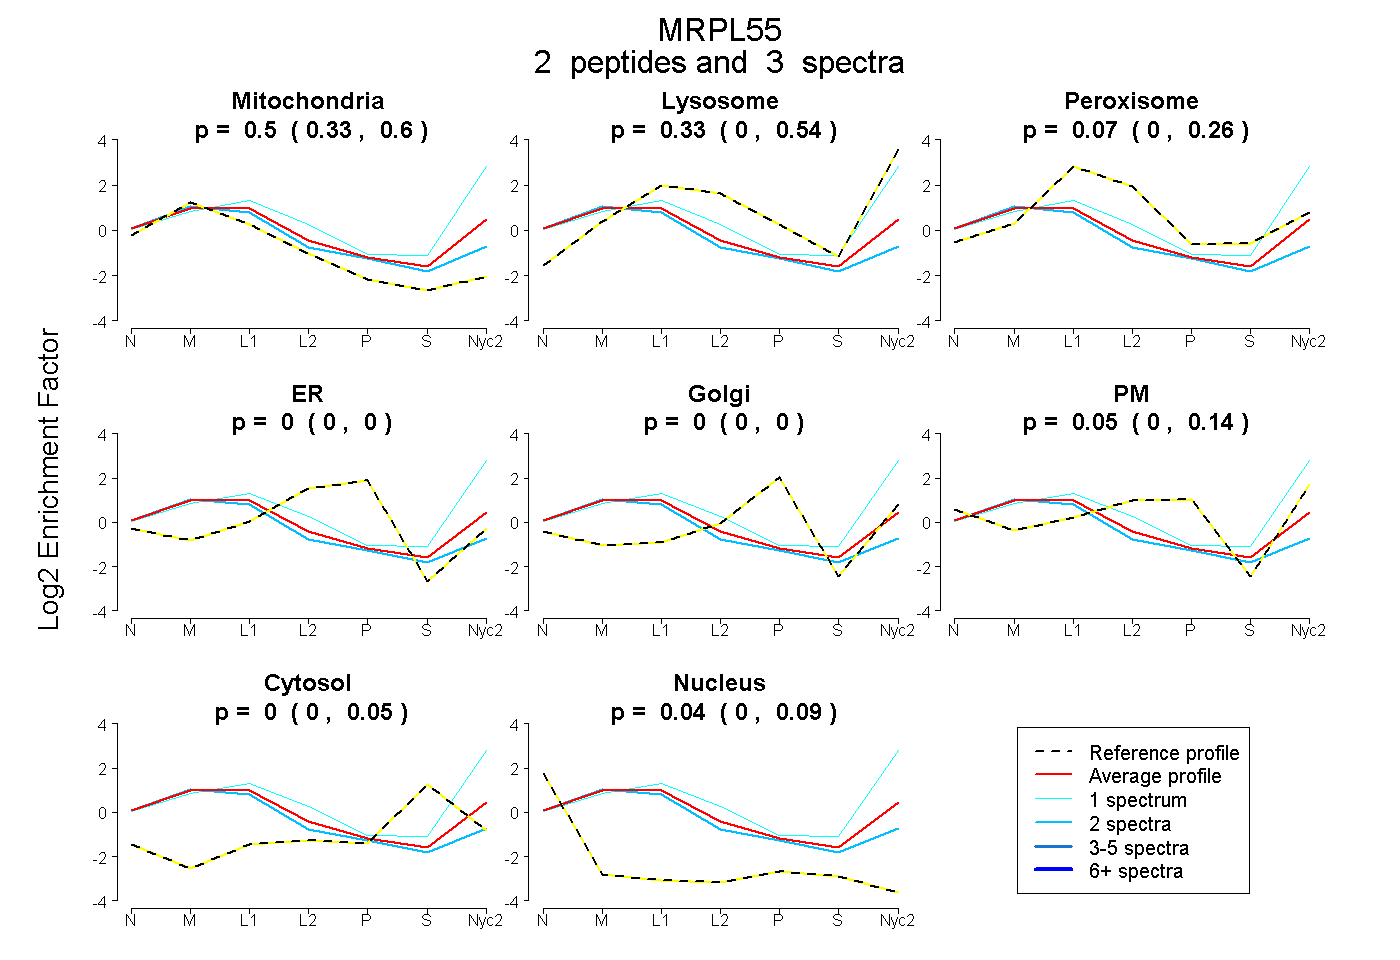
0.330 | 0.598
0.000 | 0.544
0.000 | 0.257
0.000 | 0.000
0.000 | 0.000
0.000 | 0.141
0.000 | 0.049
0.000 | 0.087
1peptide
spectra
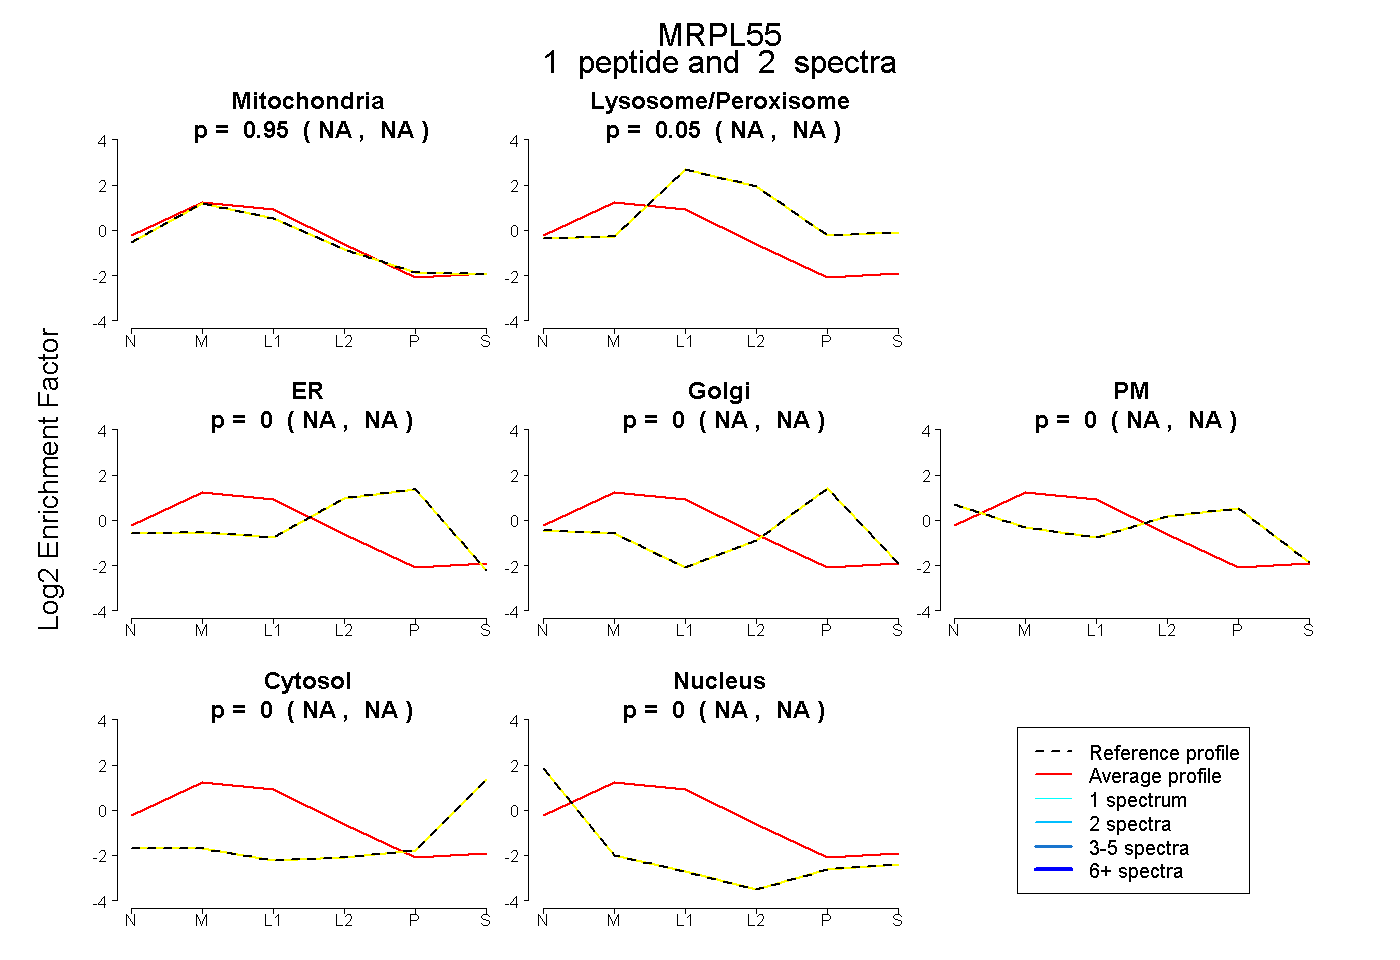
NA | NA
NA | NA
NA | NA
NA | NA
NA | NA
NA | NA
NA | NA
3peptides
spectra
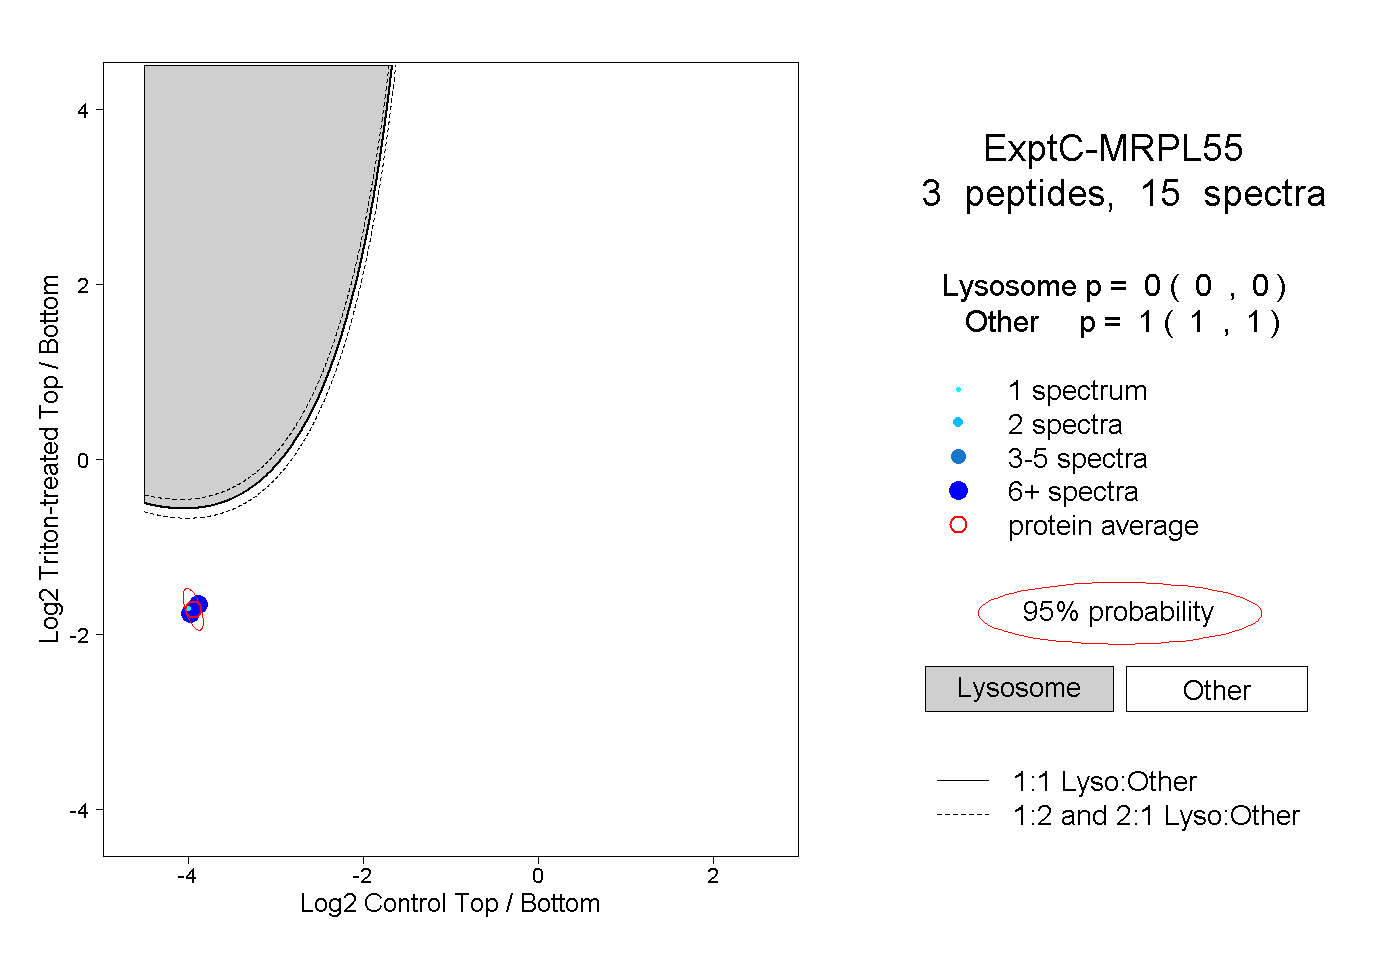
0.000 | 0.000
1.000 | 1.000
1peptide
spectrum
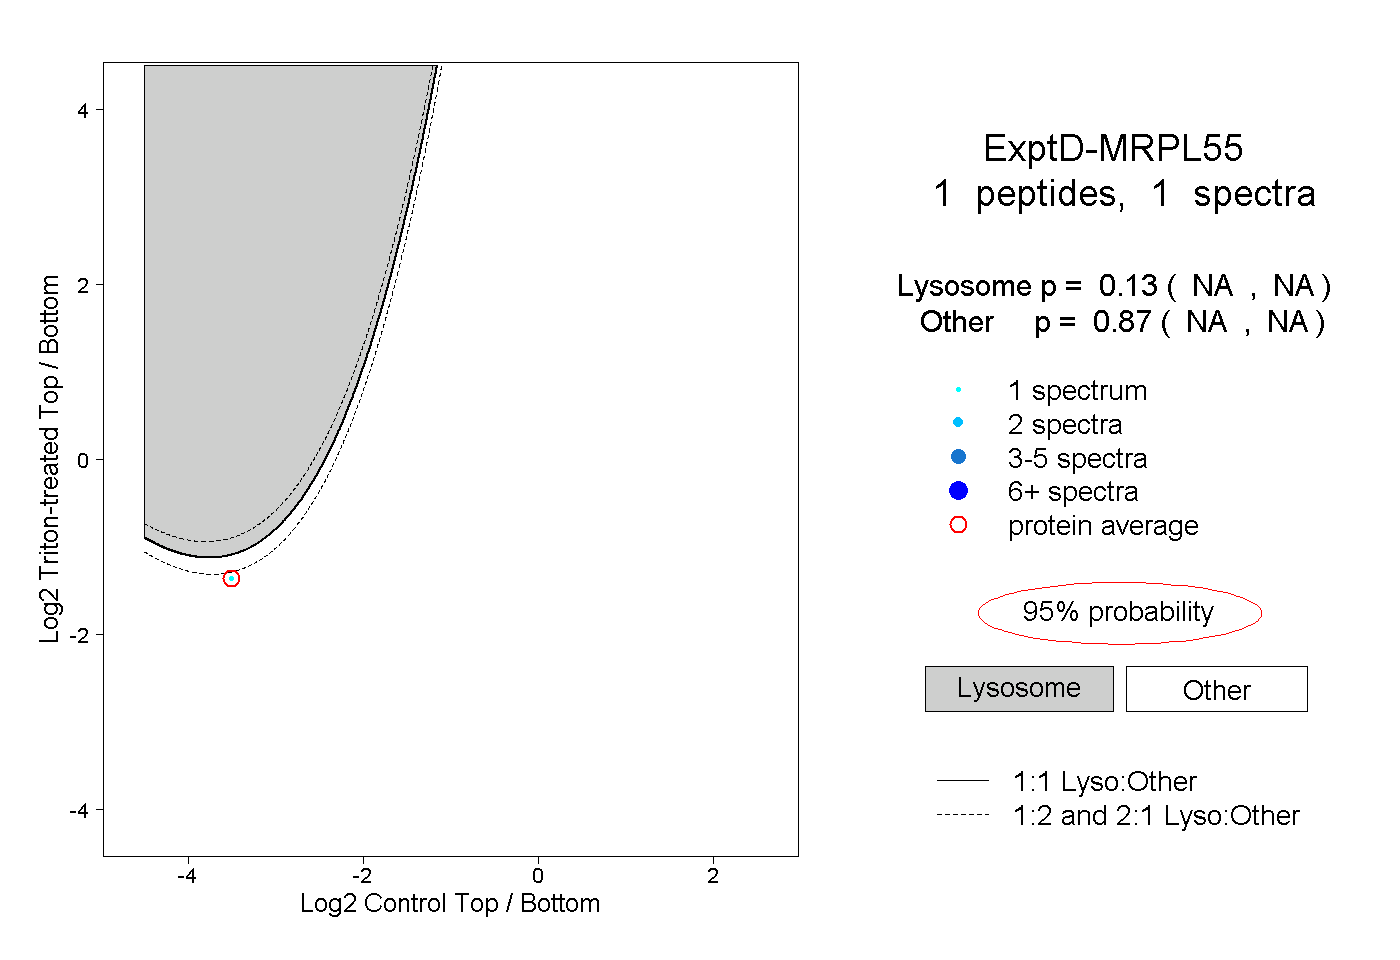
NA | NA
NA | NA