 5
5peptides
spectra
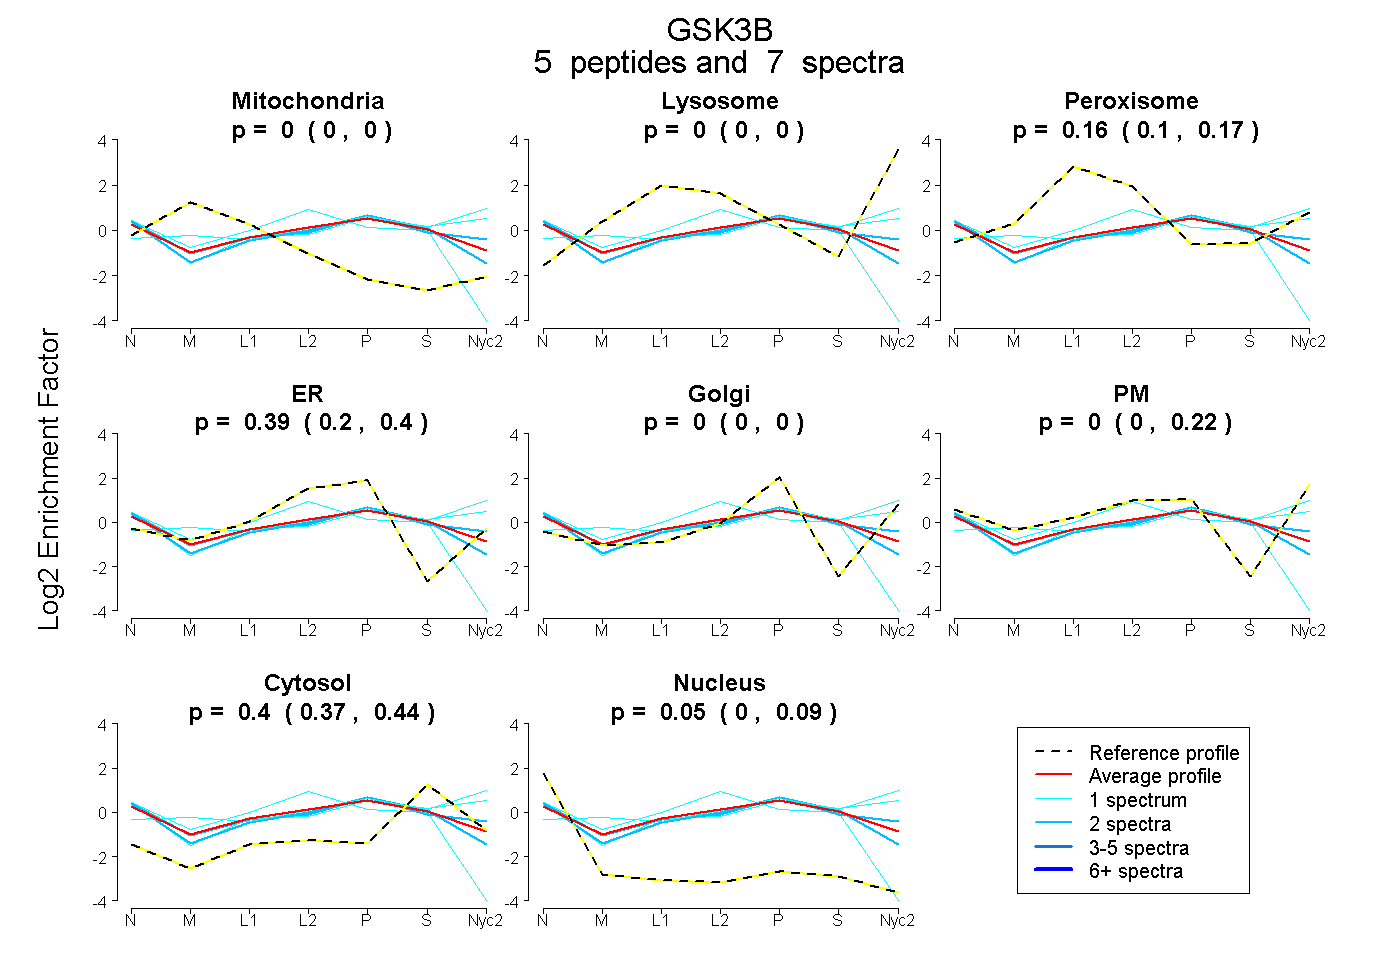
0.000 | 0.000
0.000 | 0.000
0.096 | 0.171
0.204 | 0.402
0.000 | 0.000
0.000 | 0.220
0.369 | 0.435
0.000 | 0.086
2peptides
spectra
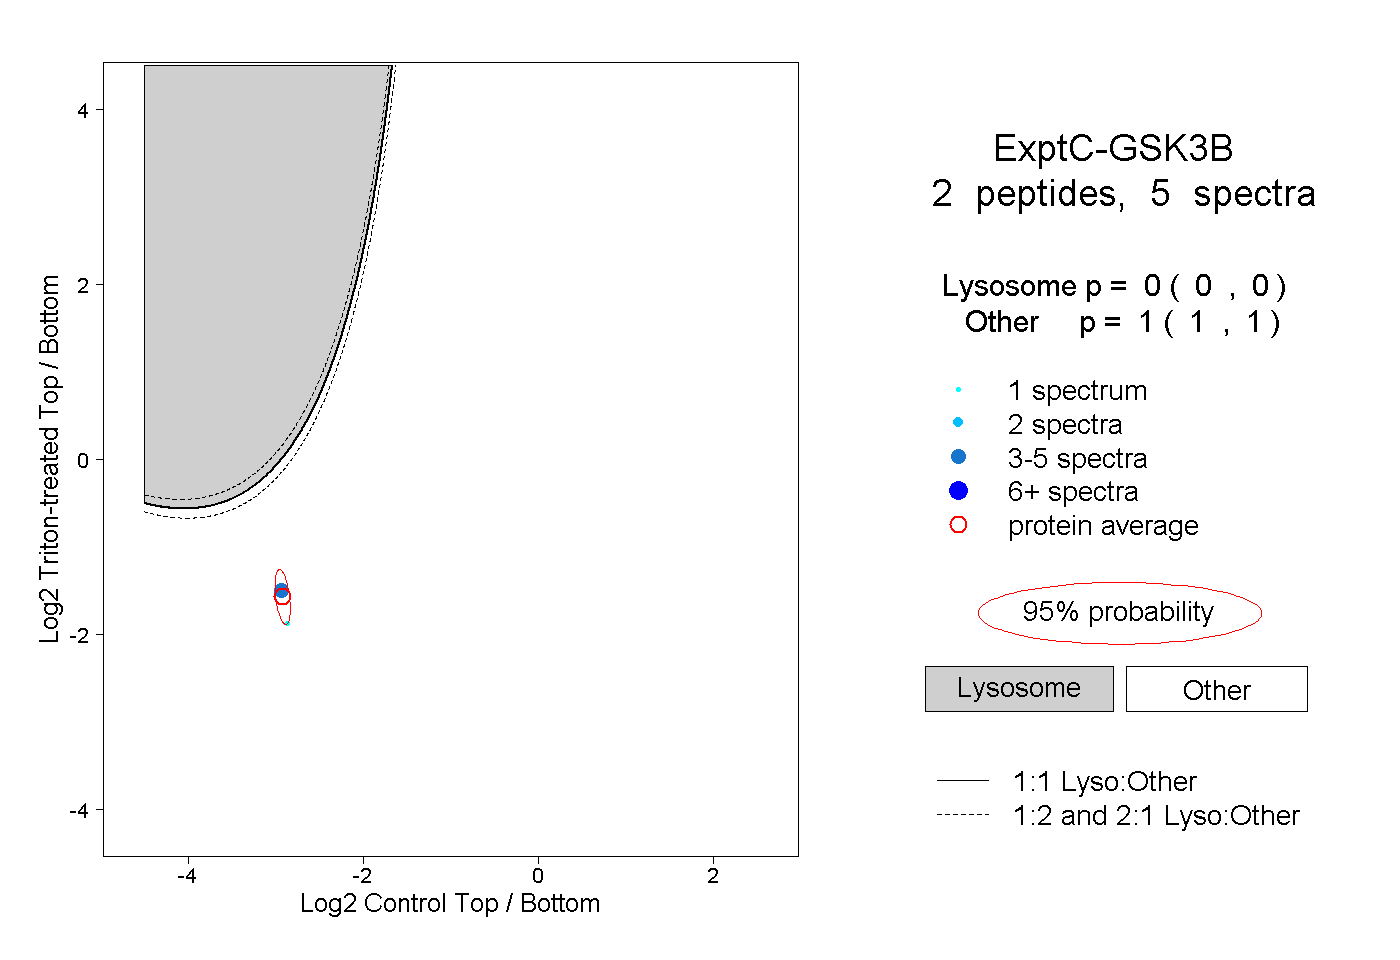
0.000 | 0.000
1.000 | 1.000
1peptide
spectra
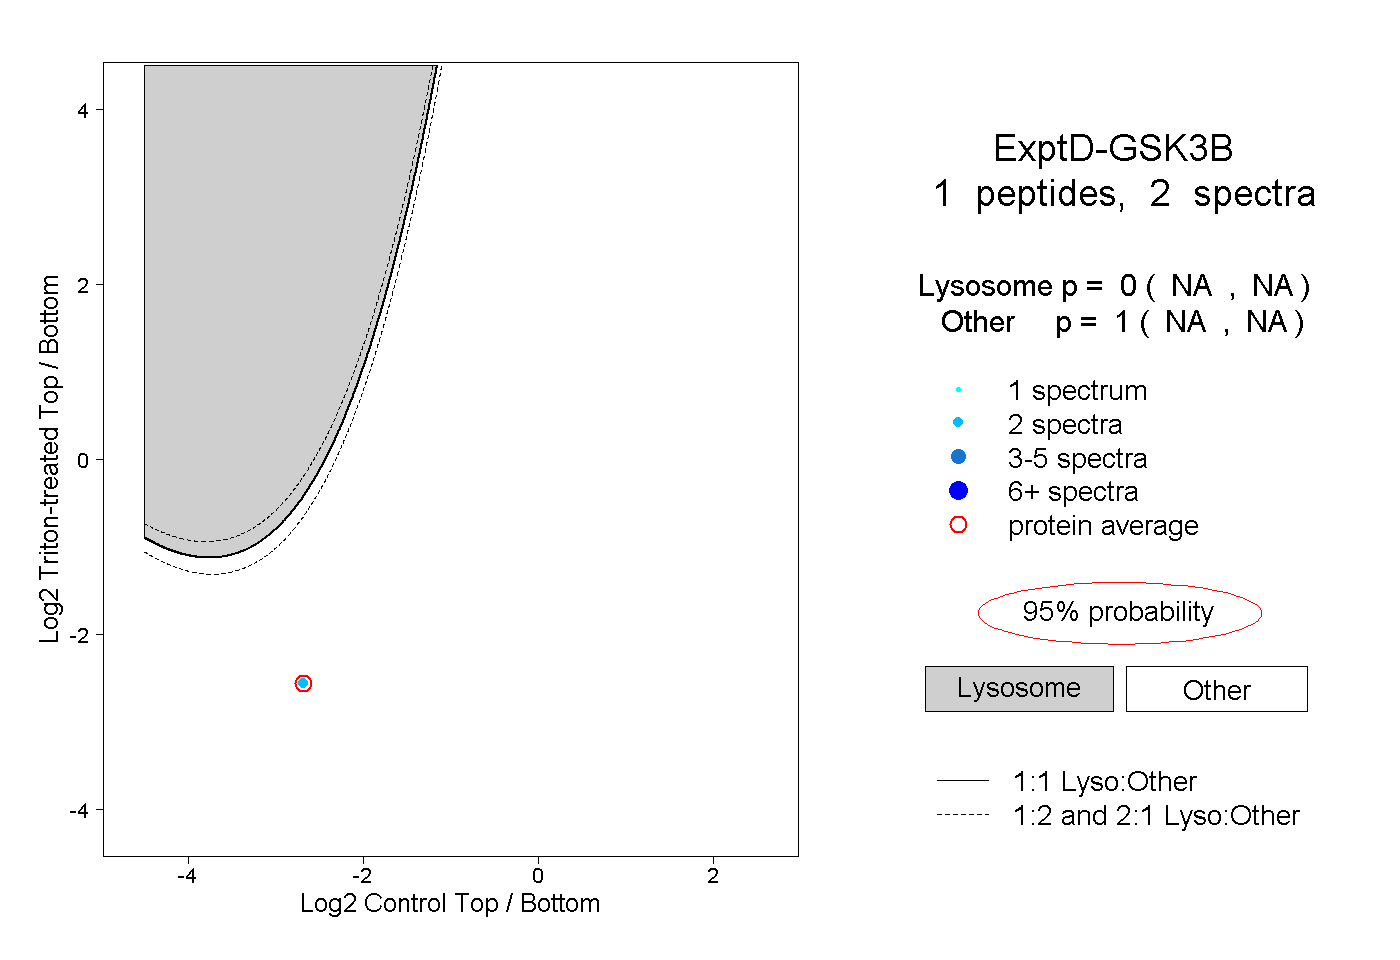
NA | NA
NA | NA