 6
6peptides
spectra
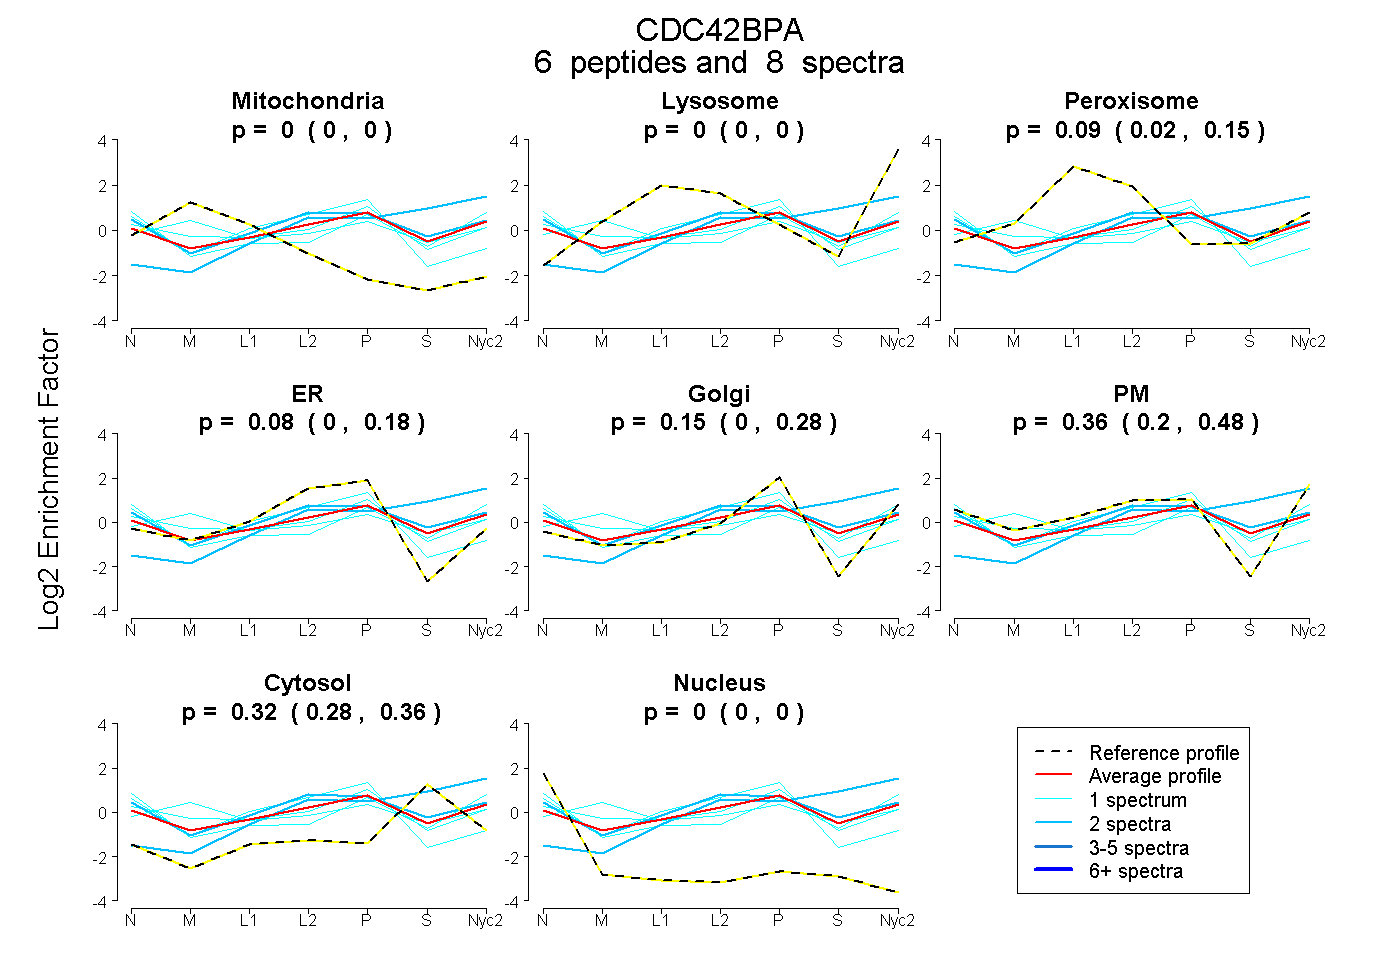
0.000 | 0.000
0.000 | 0.000
0.021 | 0.154
0.000 | 0.180
0.000 | 0.277
0.201 | 0.484
0.281 | 0.357
0.000 | 0.000
1peptide
spectrum
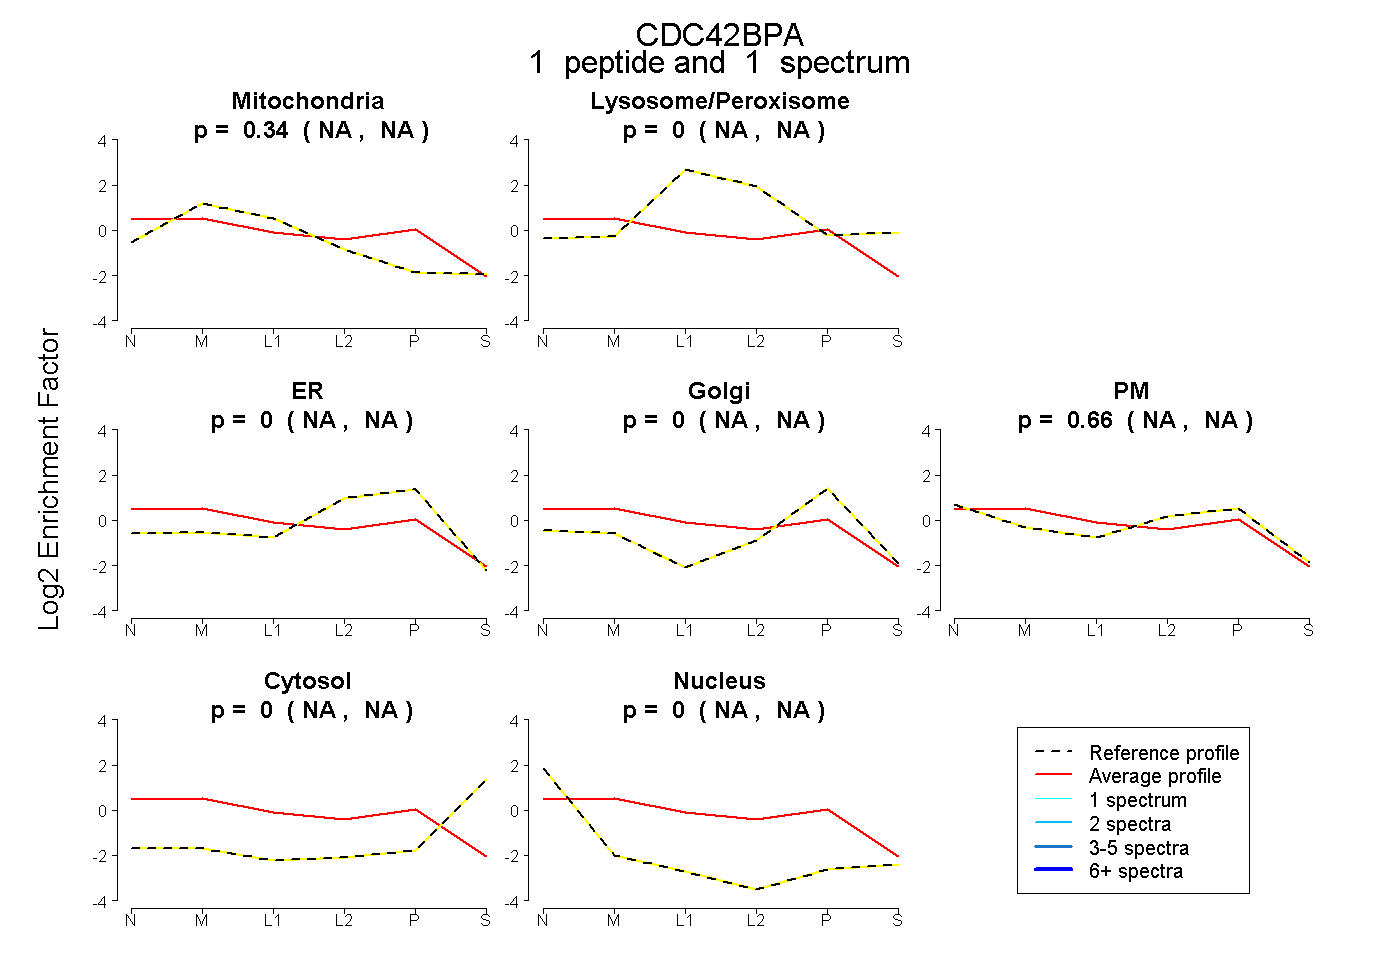
NA | NA
NA | NA
NA | NA
NA | NA
NA | NA
NA | NA
NA | NA
4peptides
spectra
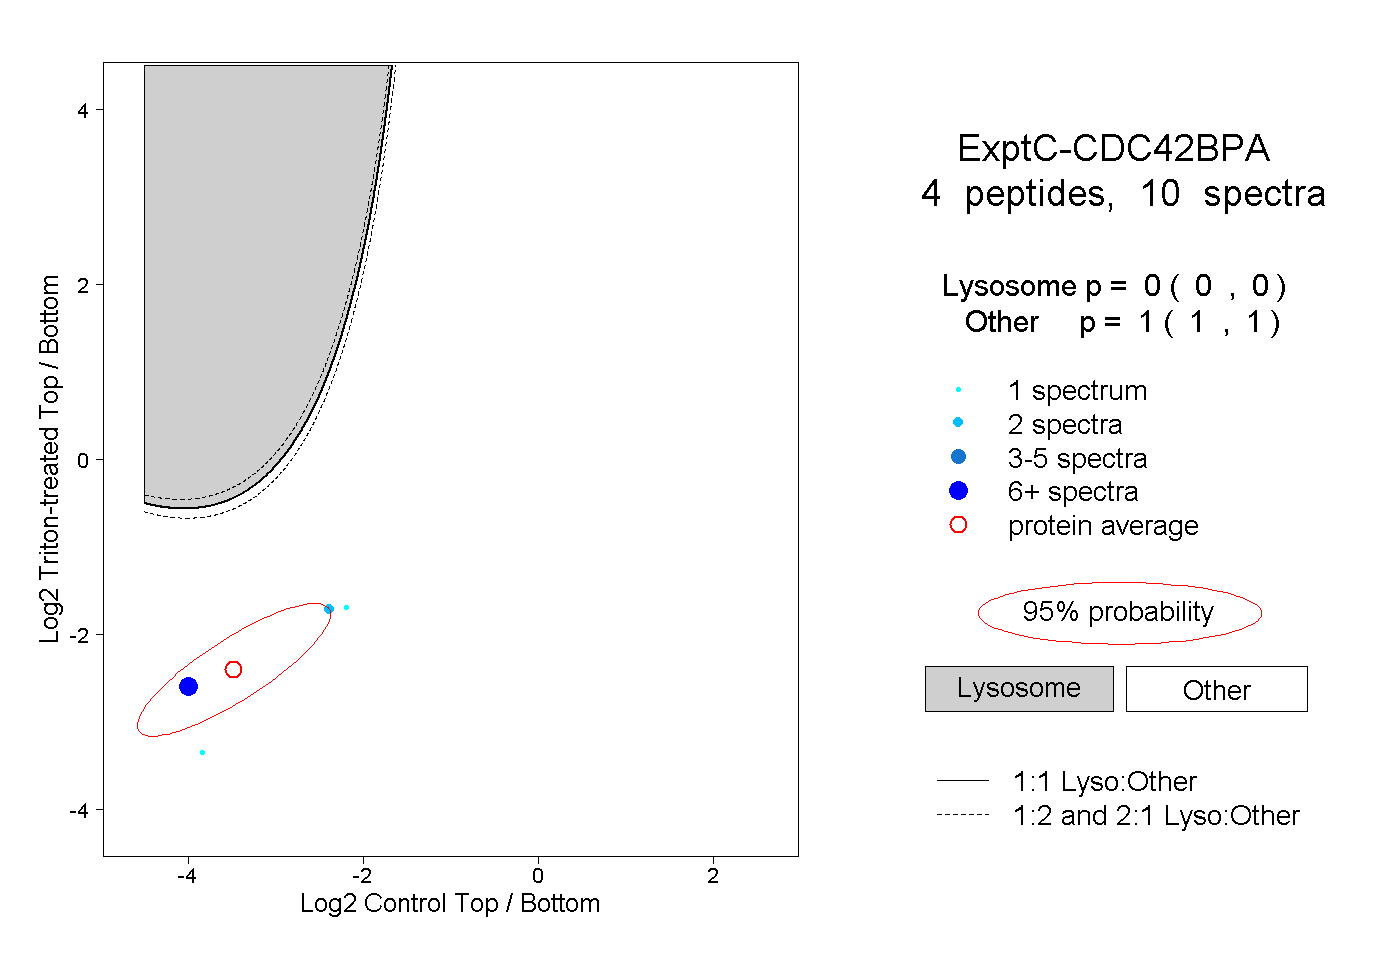
0.000 | 0.000
1.000 | 1.000
1peptide
spectrum
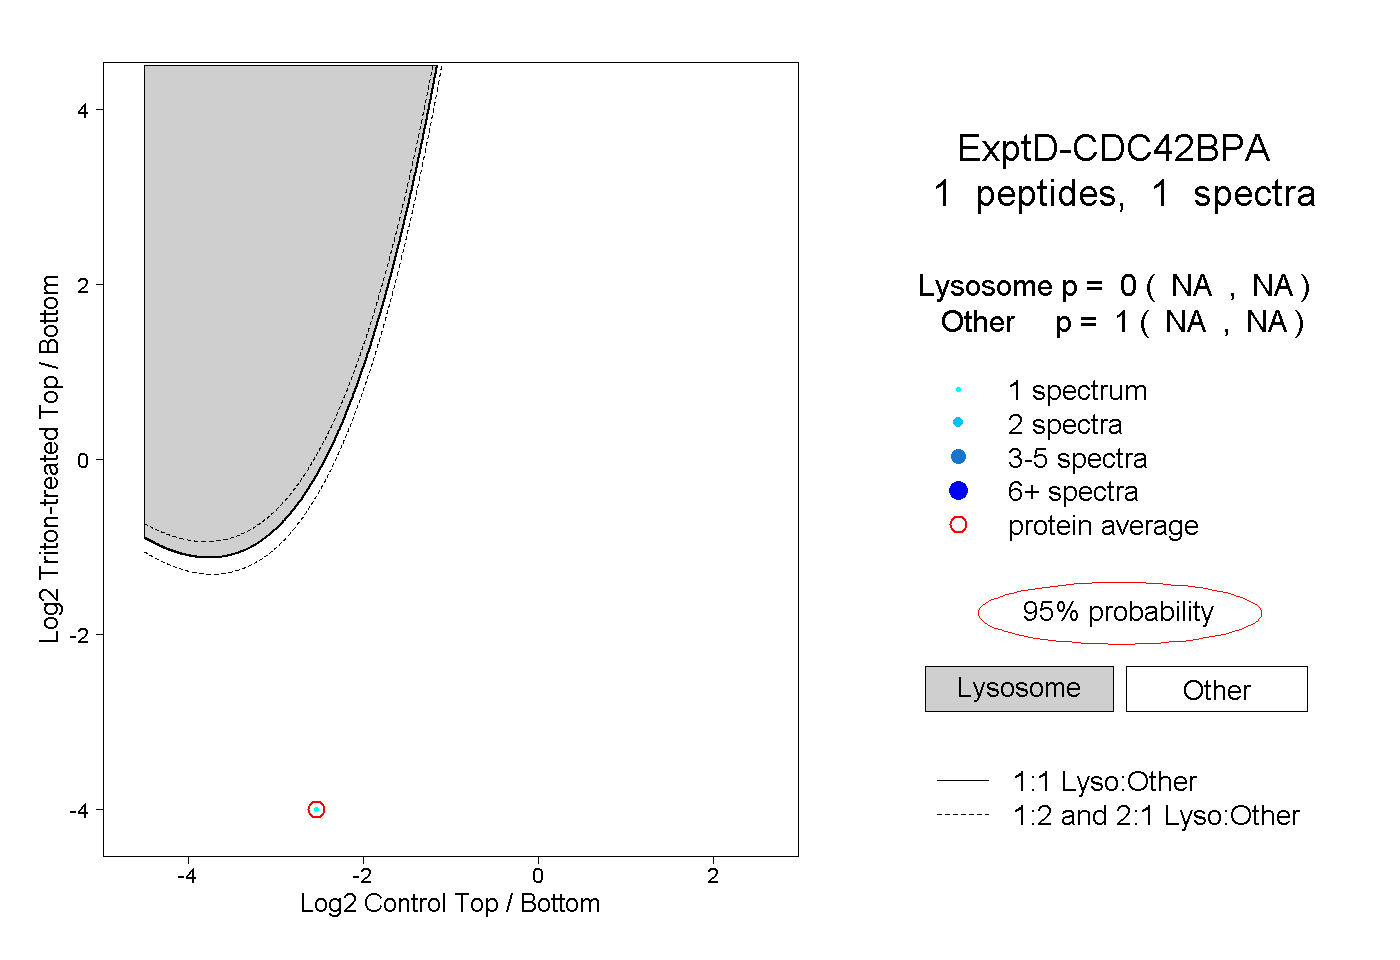
NA | NA
NA | NA