 6
6peptides
spectra
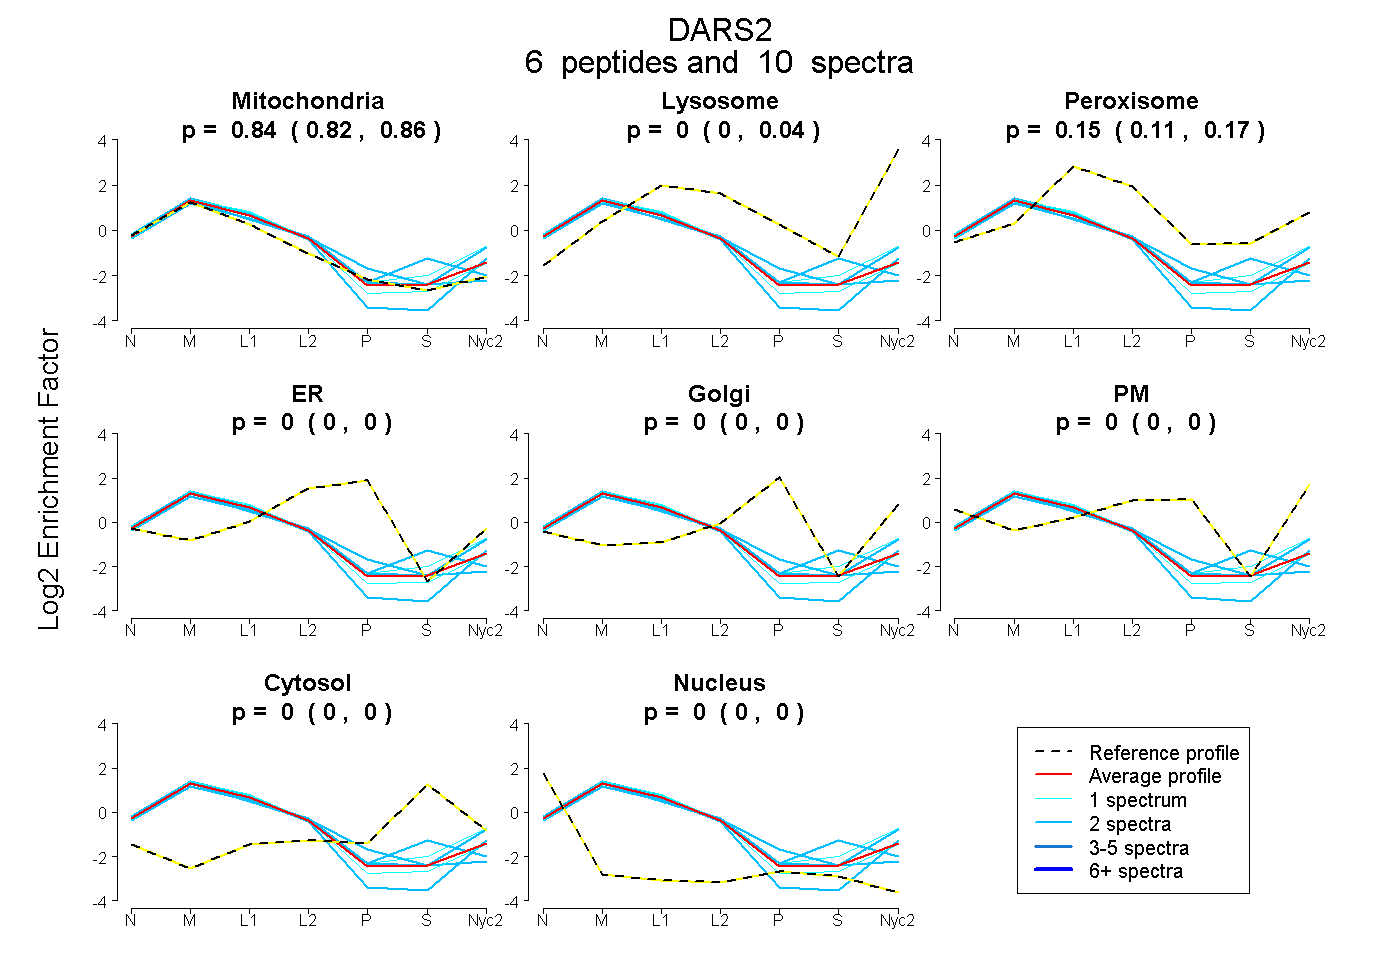
0.825 | 0.862
0.000 | 0.036
0.111 | 0.168
0.000 | 0.000
0.000 | 0.000
0.000 | 0.000
0.000 | 0.000
0.000 | 0.000
1peptide
spectrum
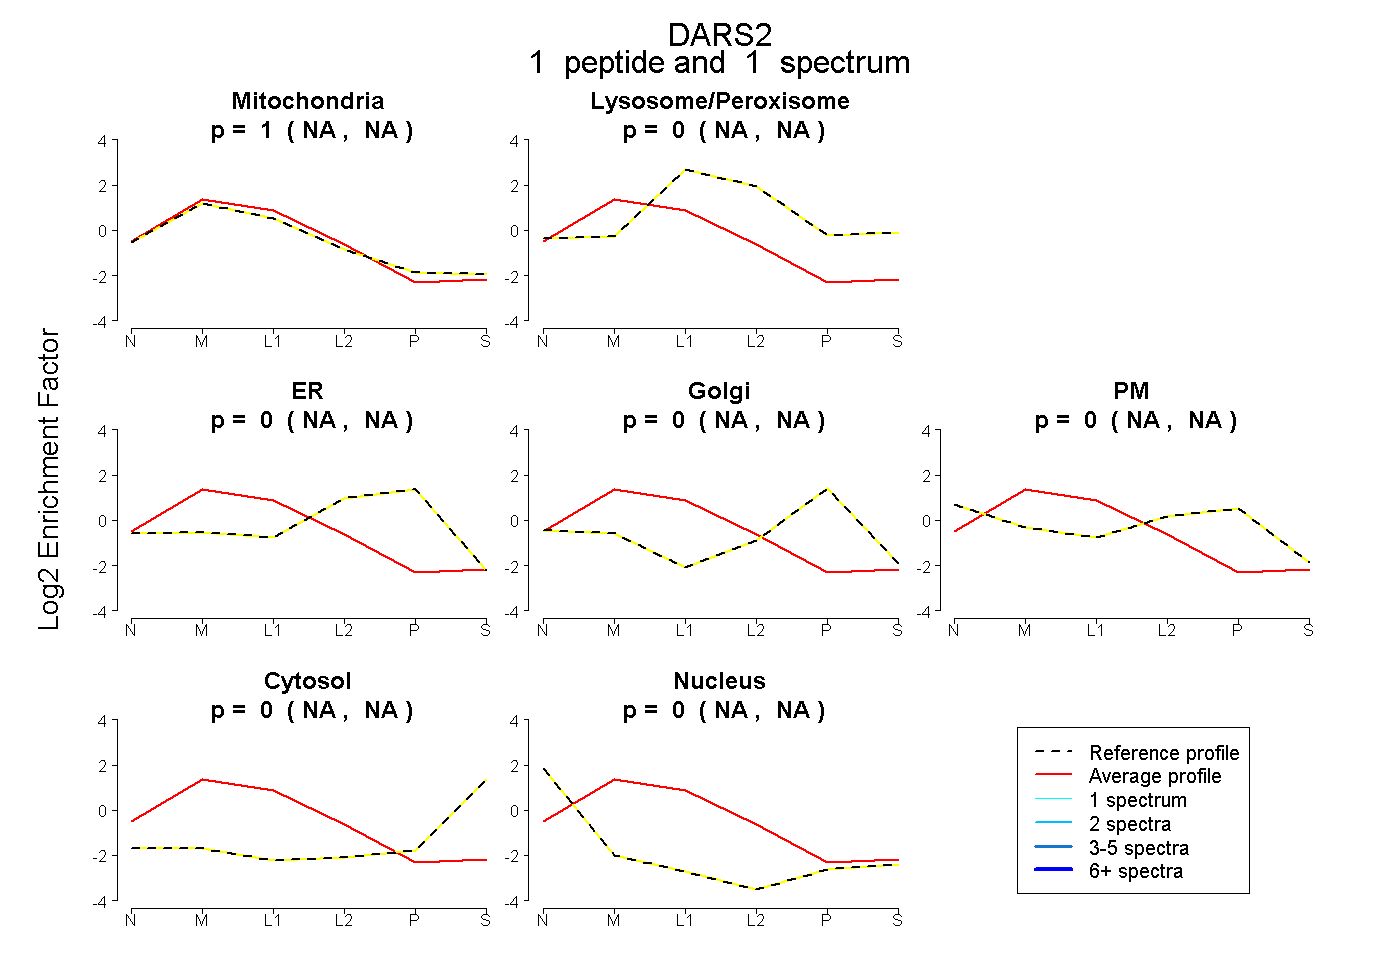
NA | NA
NA | NA
NA | NA
NA | NA
NA | NA
NA | NA
NA | NA
21peptides
spectra
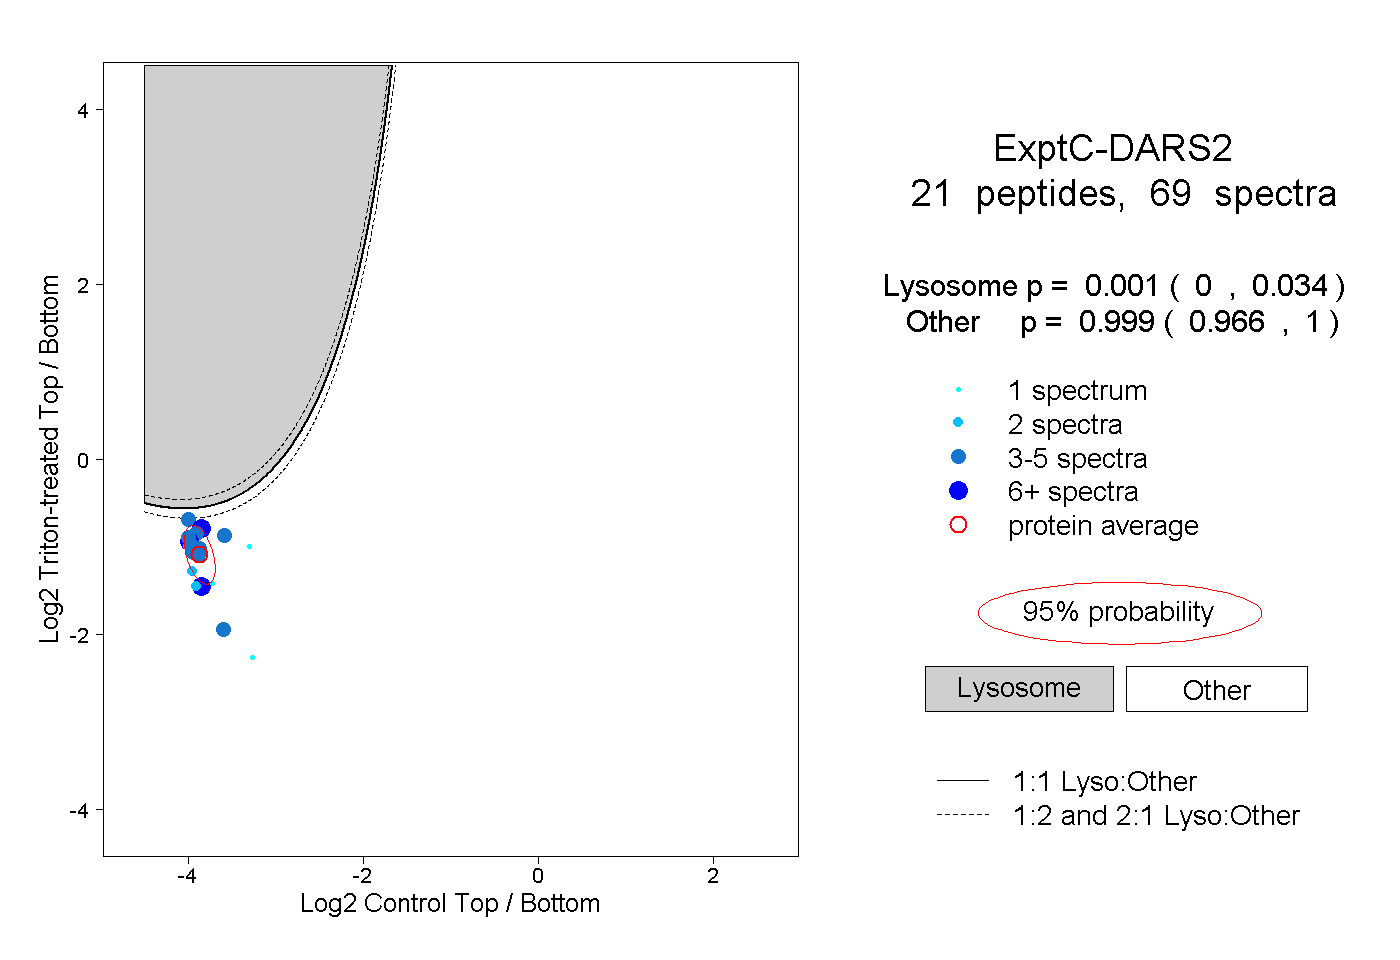
0.000 | 0.034
0.966 | 1.000
4peptides
spectra
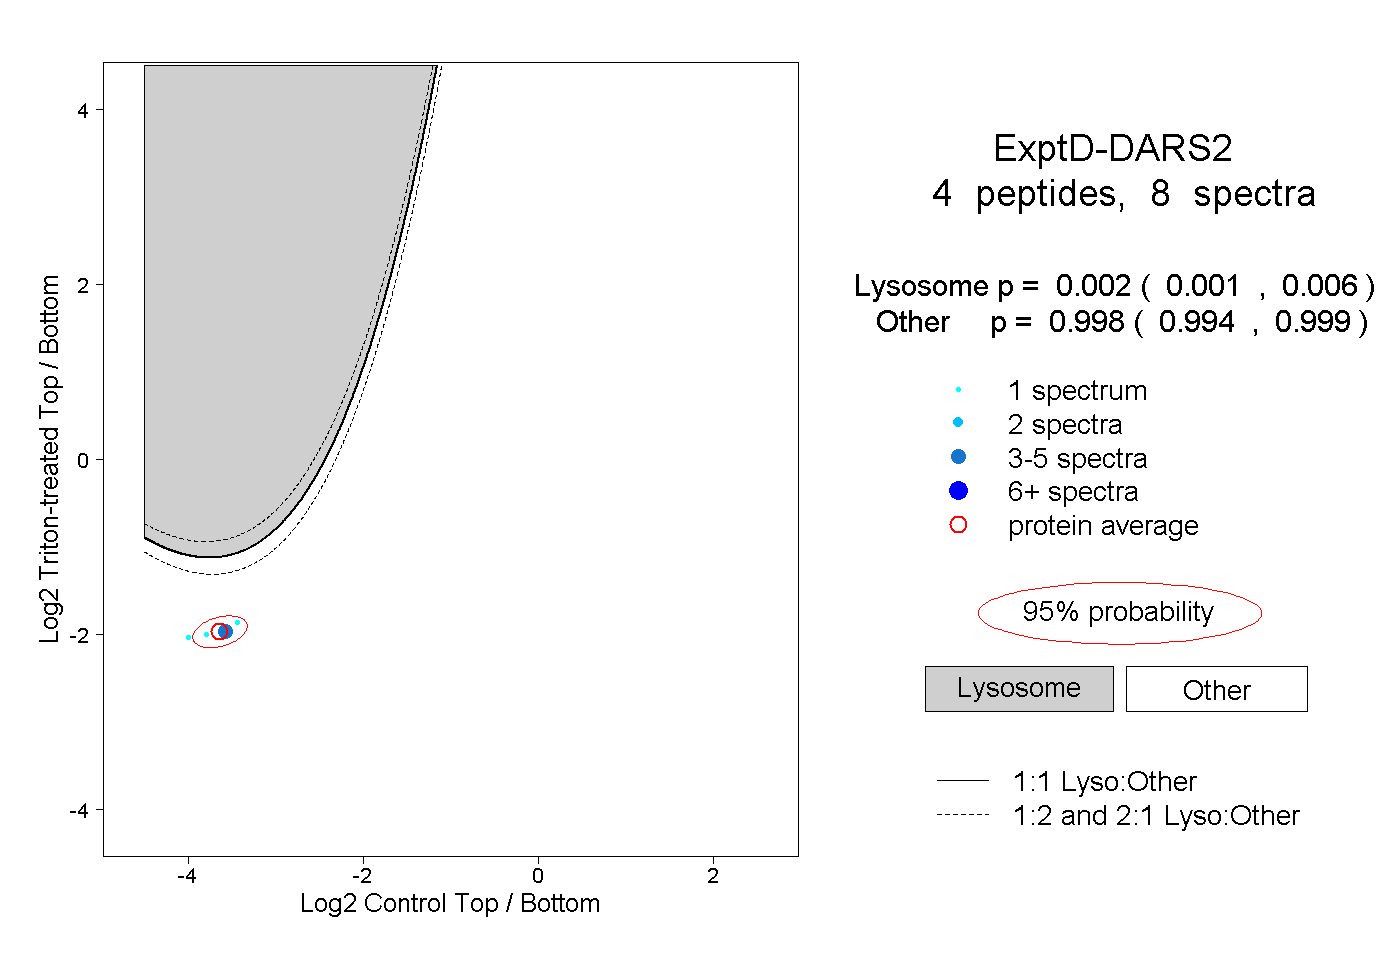
0.001 | 0.006
0.994 | 0.999