 3
3peptides
spectra
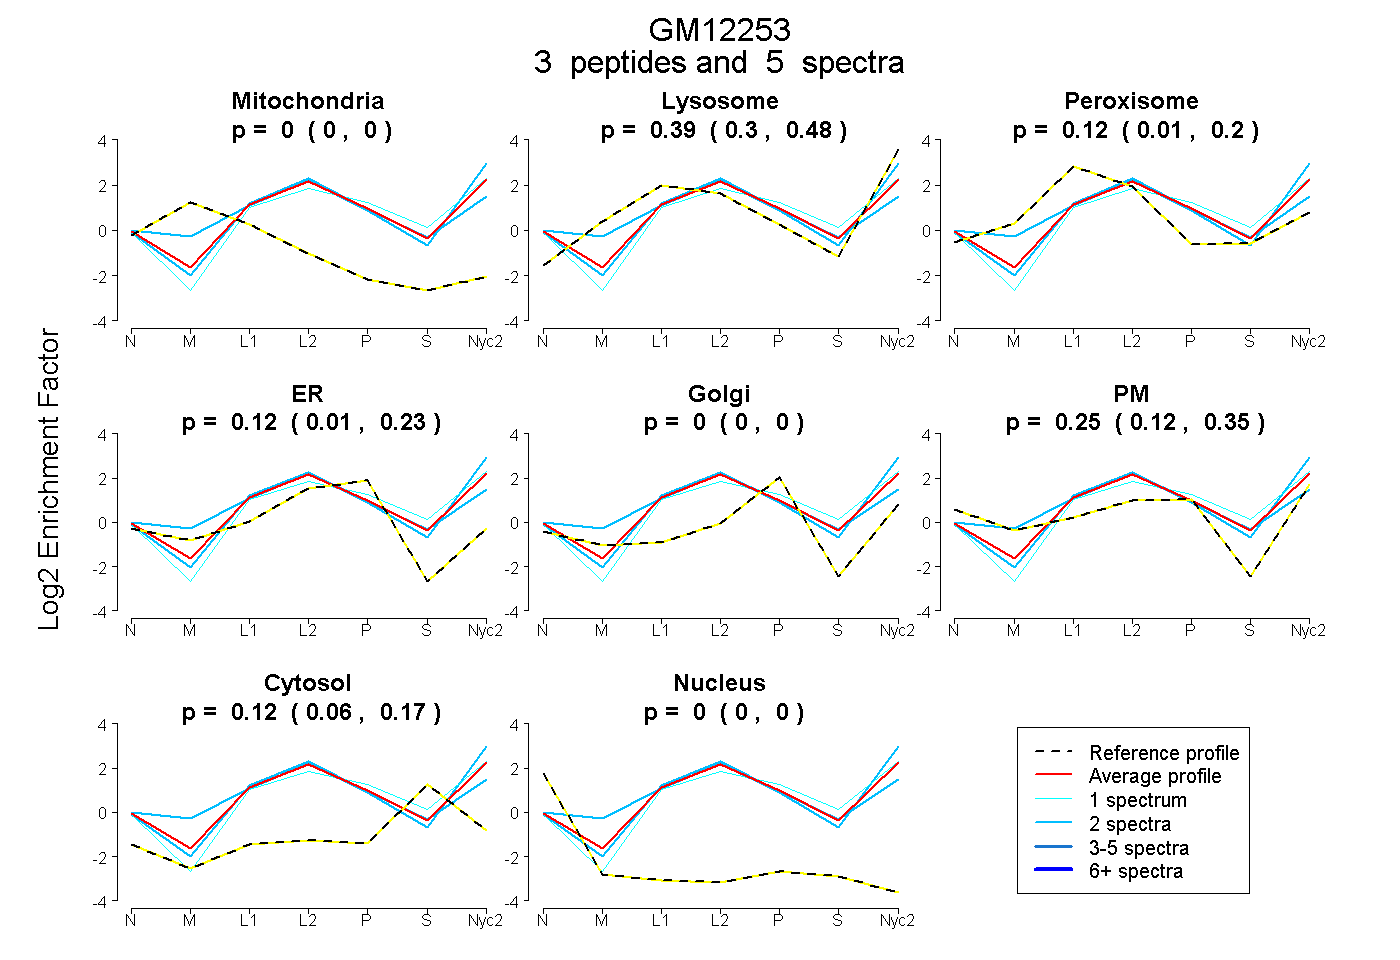
0.000 | 0.000
0.300 | 0.478
0.013 | 0.202
0.008 | 0.229
0.000 | 0.000
0.121 | 0.348
0.059 | 0.165
0.000 | 0.000
5peptides
spectra
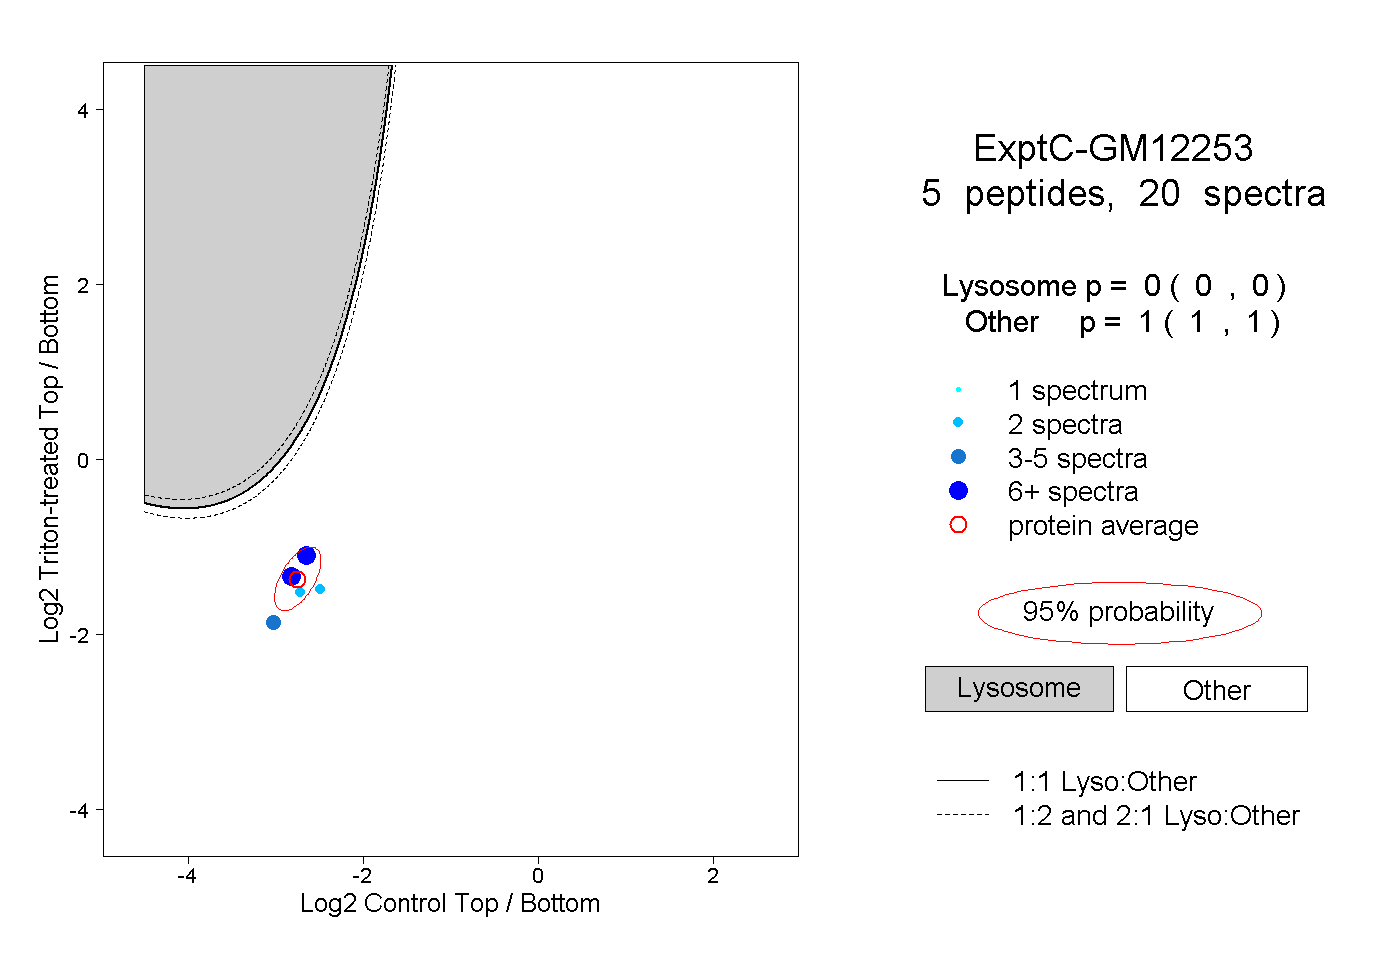
0.000 | 0.000
1.000 | 1.000
1peptide
spectrum
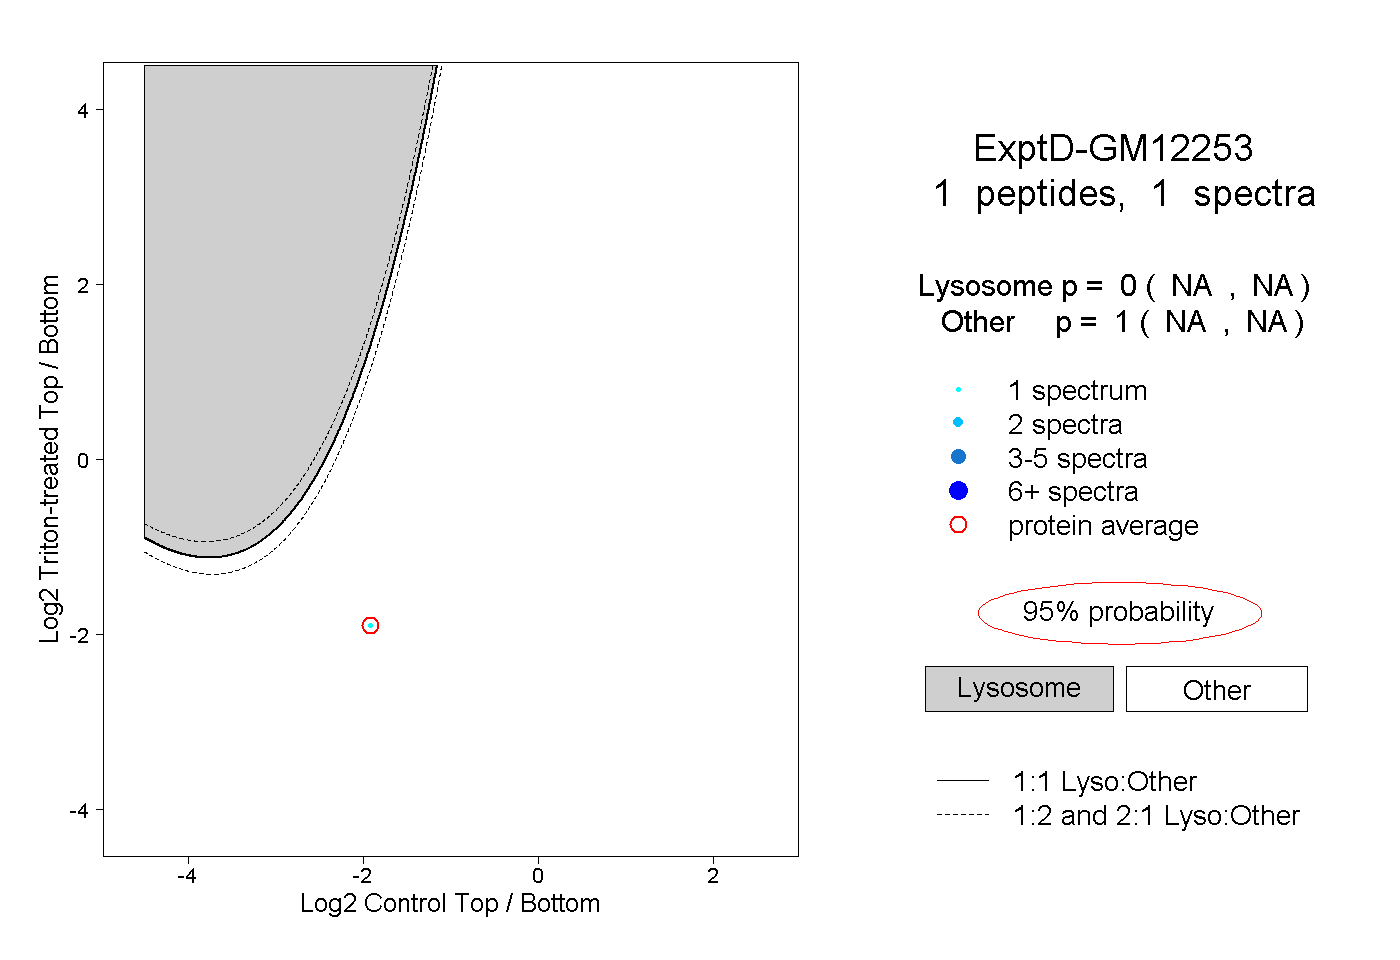
NA | NA
NA | NA