 3
3peptides
spectra
0.000 | 0.000
0.300 | 0.478
0.013 | 0.202
0.008 | 0.229
0.000 | 0.000
0.121 | 0.348
0.059 | 0.165
0.000 | 0.000
5peptides
spectra
0.000 | 0.000
1.000 | 1.000
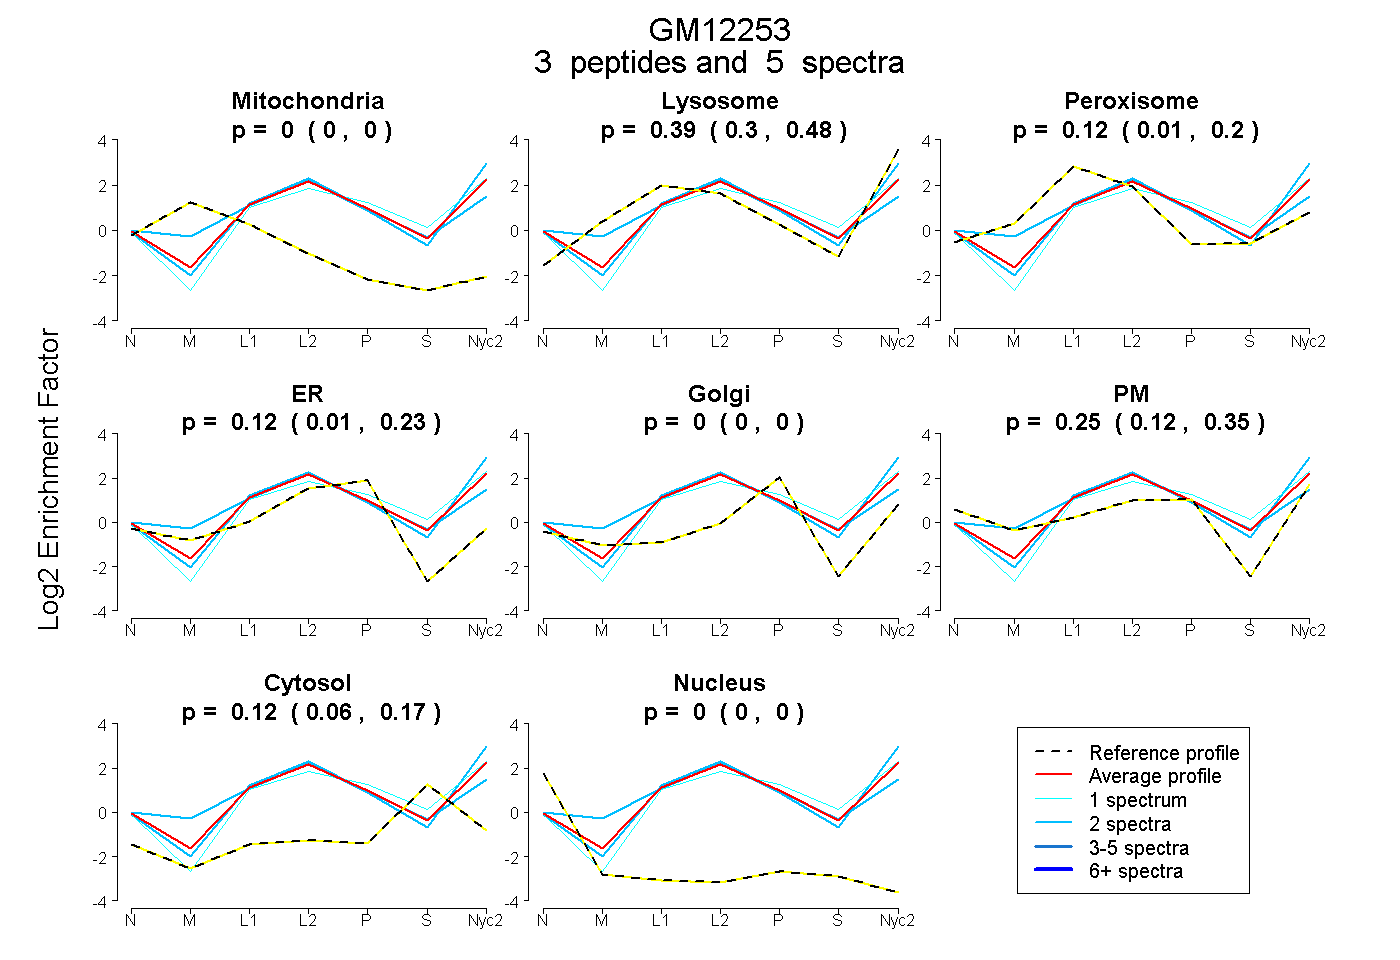
| Plot | Mito | Lyso | Perox | ER | Golgi | PM | Cytosol | Nucleus | |||||
| Expt A |
3 peptides |
5 spectra |
|
0.000 0.000 | 0.000 |
0.395 0.300 | 0.478 |
0.116 0.013 | 0.202 |
0.124 0.008 | 0.229 |
0.000 0.000 | 0.000 |
0.249 0.121 | 0.348 |
0.117 0.059 | 0.165 |
0.000 0.000 | 0.000 |
||
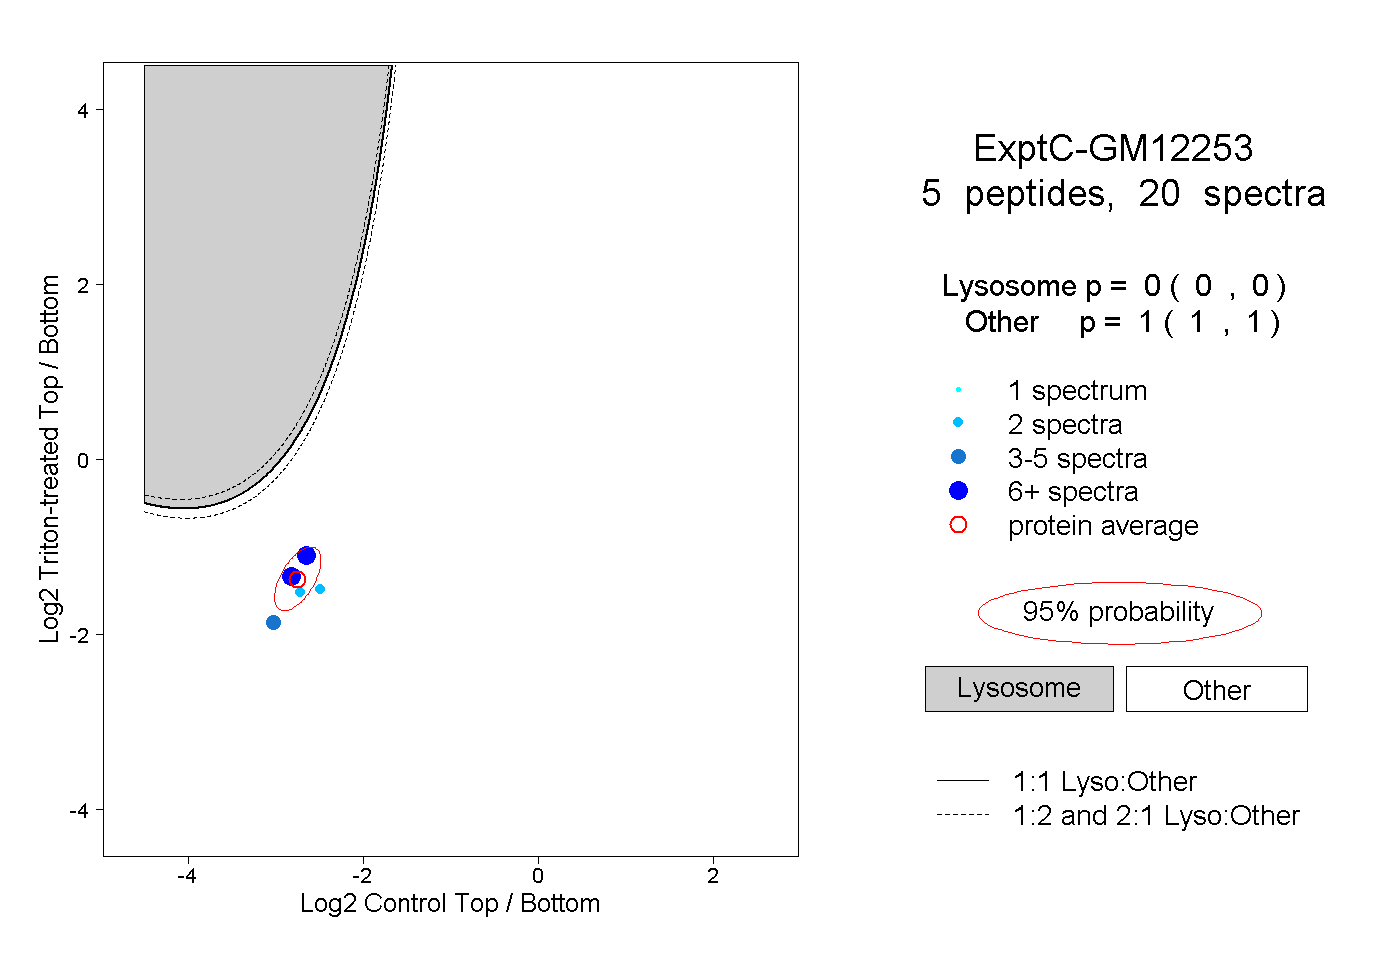
| Plot | Lyso | Other | |||||||||||
| Expt C |
5 peptides |
20 spectra |
|
0.000 0.000 | 0.000 |
1.000 1.000 | 1.000 |
| 3 spectra, IHAMGCATQTACNLK | 0.000 | 1.000 | ||||||||
| 2 spectra, YSPSLSTDQK | 0.000 | 1.000 | ||||||||
| 2 spectra, IDTSCVSGSPPLR | 0.000 | 1.000 | ||||||||
| 6 spectra, NVIILNNIK | 0.000 | 1.000 | ||||||||
| 7 spectra, SCEFSK | 0.000 | 1.000 |
| Plot | Lyso | Other | |||||||||||
| Expt D |
1 peptide |
1 spectrum |
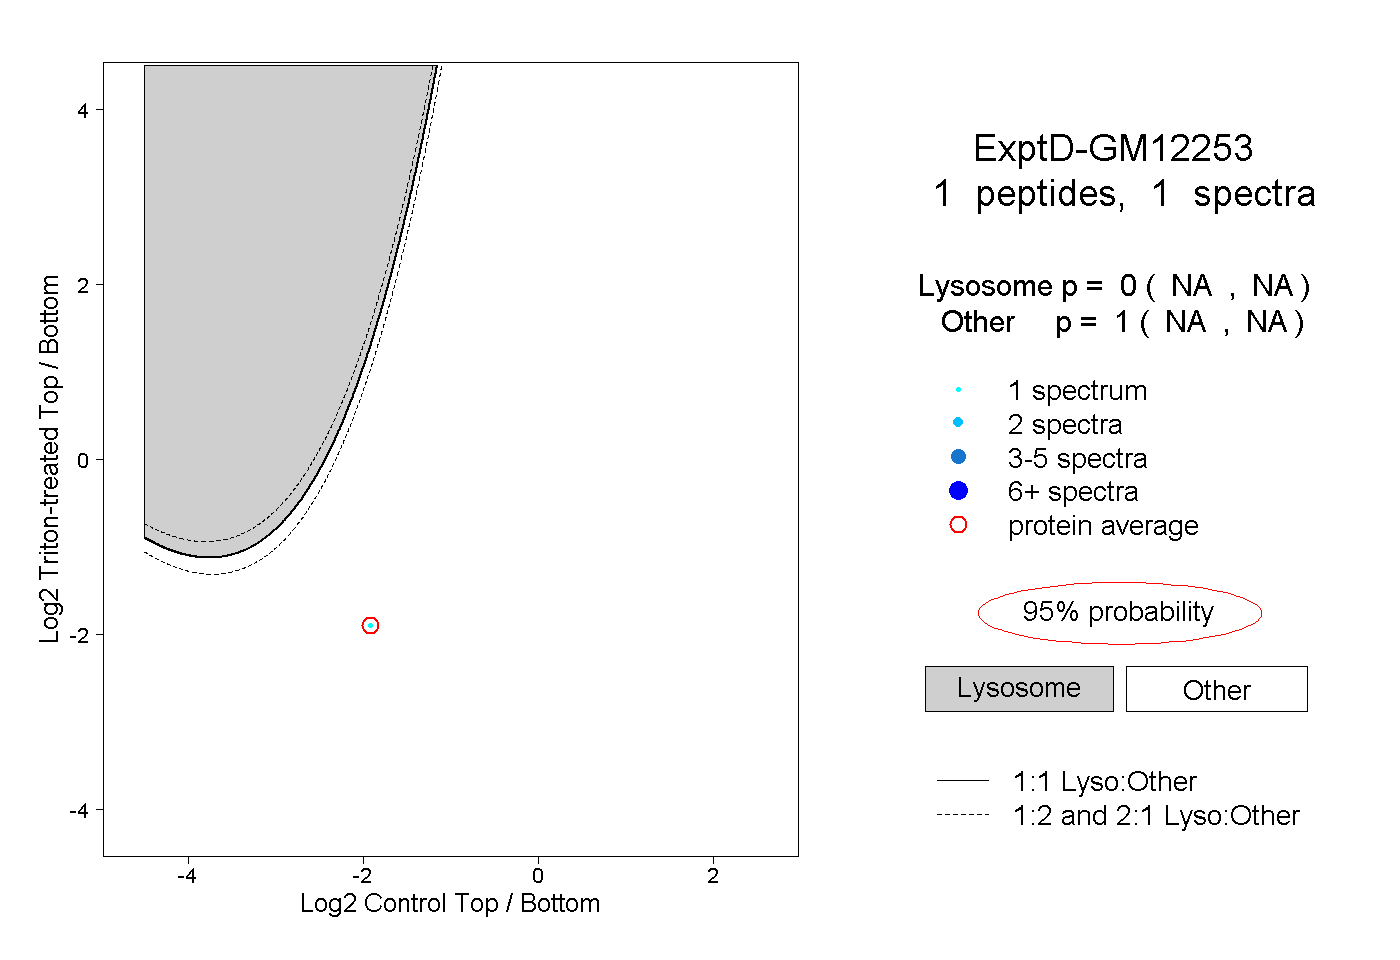 |
0.000 NA | NA |
1.000 NA | NA |