 7
7peptides
spectra
0.000 | 0.000
0.000 | 0.000
0.000 | 0.000
0.000 | 0.000
0.000 | 0.000
0.000 | 0.000
0.963 | 0.980
0.019 | 0.036
| Plot | Mito | Lyso | Perox | ER | Golgi | PM | Cytosol | Nucleus | |||||
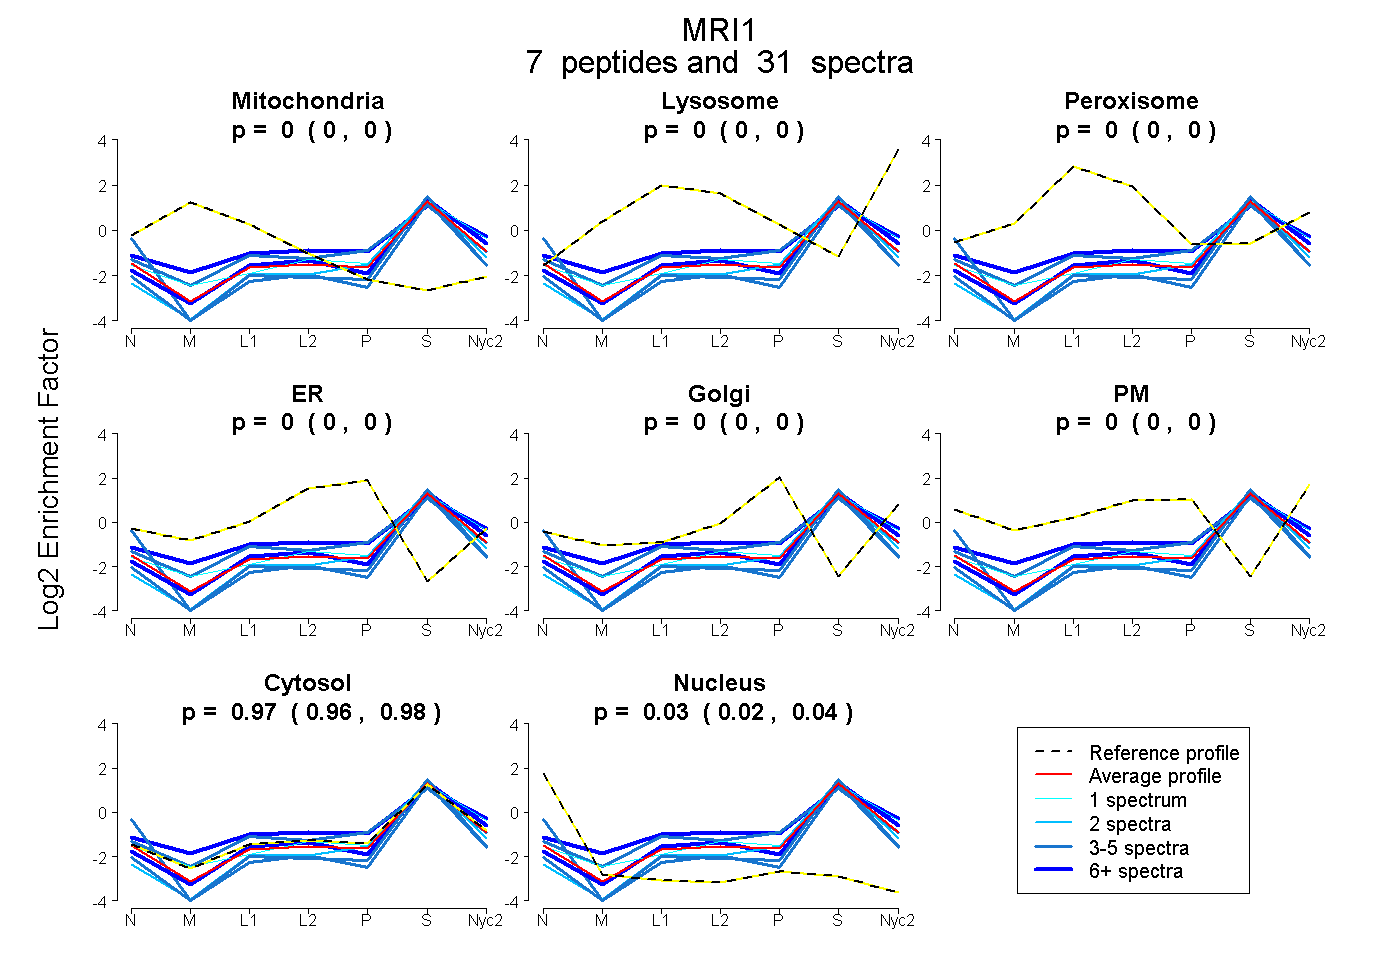
| Expt A |
7 peptides |
31 spectra |
|
0.000 0.000 | 0.000 |
0.000 0.000 | 0.000 |
0.000 0.000 | 0.000 |
0.000 0.000 | 0.000 |
0.000 0.000 | 0.000 |
0.000 0.000 | 0.000 |
0.972 0.963 | 0.980 |
0.028 0.019 | 0.036 |
| 3 spectra, HLLEQTNPR | 0.000 | 0.000 | 0.002 | 0.064 | 0.011 | 0.000 | 0.924 | 0.000 | ||
| 2 spectra, LEHTFCTETRPYNQGAR | 0.000 | 0.000 | 0.000 | 0.000 | 0.000 | 0.000 | 1.000 | 0.000 | ||
| 9 spectra, DLTHMAAR | 0.000 | 0.069 | 0.039 | 0.000 | 0.000 | 0.055 | 0.836 | 0.000 | ||
| 3 spectra, EIVIEERPSQELTDLNGVR | 0.000 | 0.000 | 0.000 | 0.000 | 0.000 | 0.000 | 0.768 | 0.232 | ||
| 1 spectrum, IGTYQLAIVAK | 0.000 | 0.007 | 0.000 | 0.000 | 0.000 | 0.000 | 0.993 | 0.000 | ||
| 5 spectra, LTAFELVYEK | 0.000 | 0.000 | 0.000 | 0.000 | 0.000 | 0.000 | 0.931 | 0.069 | ||
| 8 spectra, FAEDMLEK | 0.000 | 0.000 | 0.000 | 0.000 | 0.000 | 0.000 | 1.000 | 0.000 |
| Plot | Mito | Lyso or Perox | ER | Golgi | PM | Cytosol | Nucleus | ||||||
| Expt B |
5 peptides |
10 spectra |
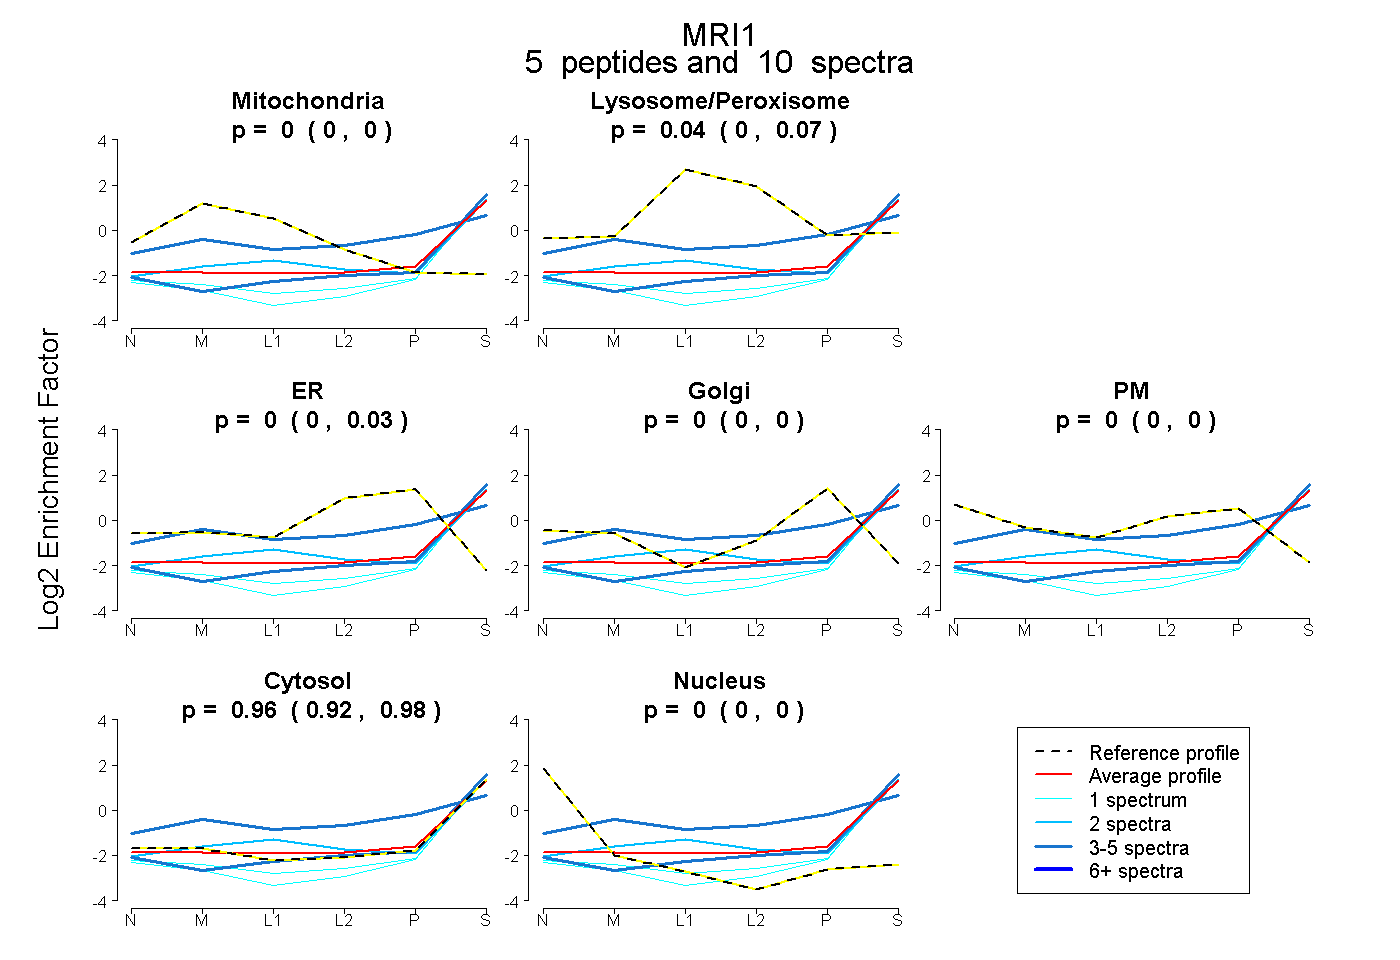 |
0.000 0.000 | 0.000 |
0.044 0.000 | 0.072 |
0.000 0.000 | 0.031 |
0.000 0.000 | 0.000 |
0.000 0.000 | 0.000 |
0.956 0.918 | 0.983 |
0.000 0.000 | 0.000 |
|||
| Plot | Lyso | Other | |||||||||||
| Expt C |
9 peptides |
32 spectra |
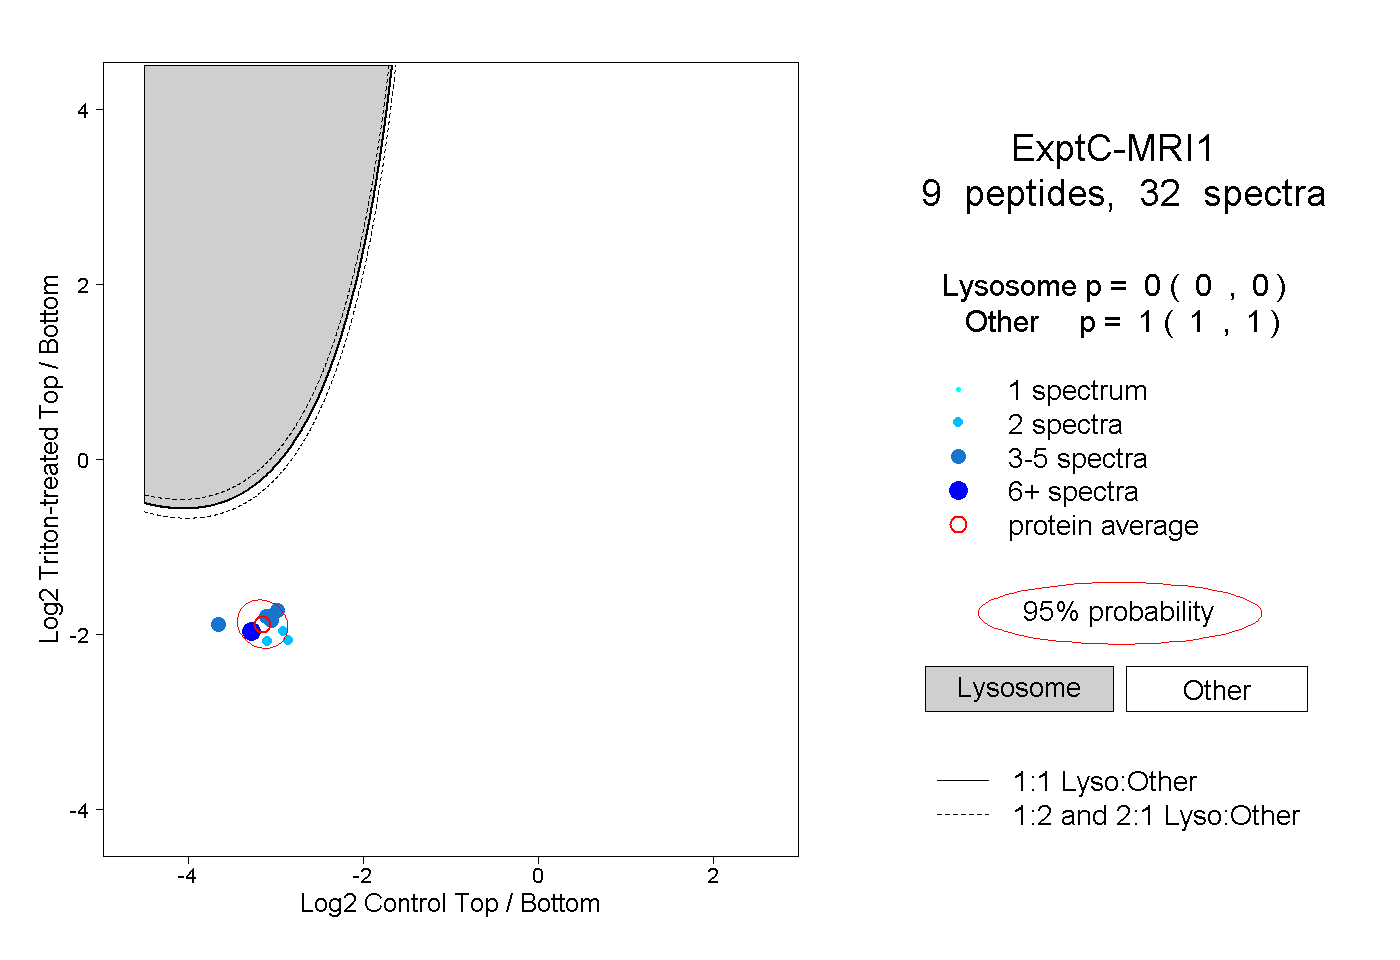 |
0.000 0.000 | 0.000 |
1.000 1.000 | 1.000 |
||||||||
| Plot | Lyso | Other | |||||||||||
| Expt D |
1 peptide |
2 spectra |
 |
0.000 NA | NA |
1.000 NA | NA |