21
21peptides
spectra
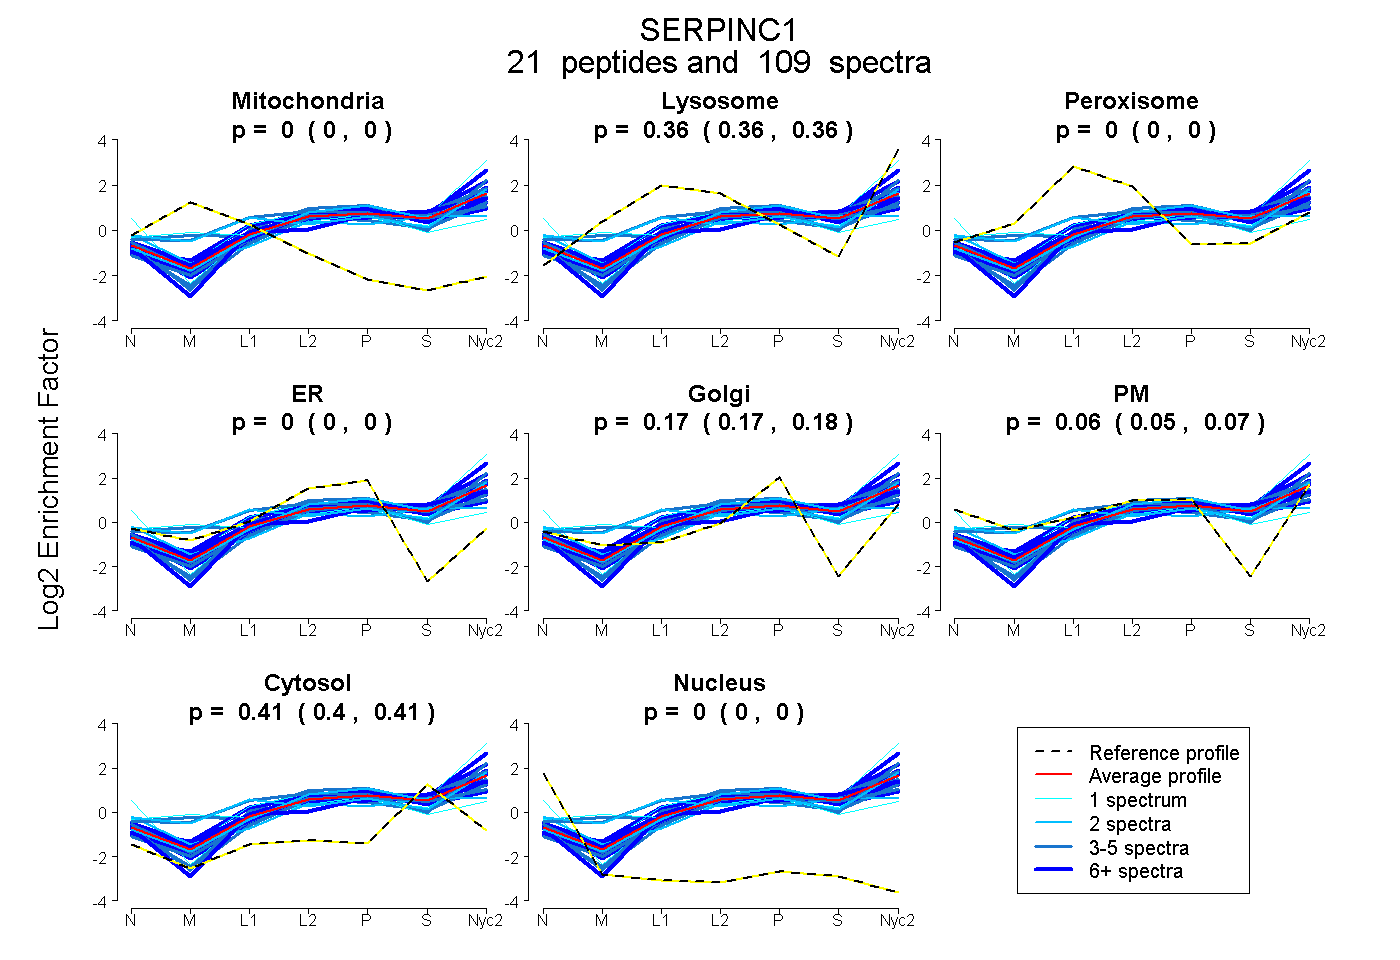
0.000 | 0.000
0.356 | 0.364
0.000 | 0.000
0.000 | 0.000
0.166 | 0.176
0.055 | 0.068
0.404 | 0.409
0.000 | 0.000
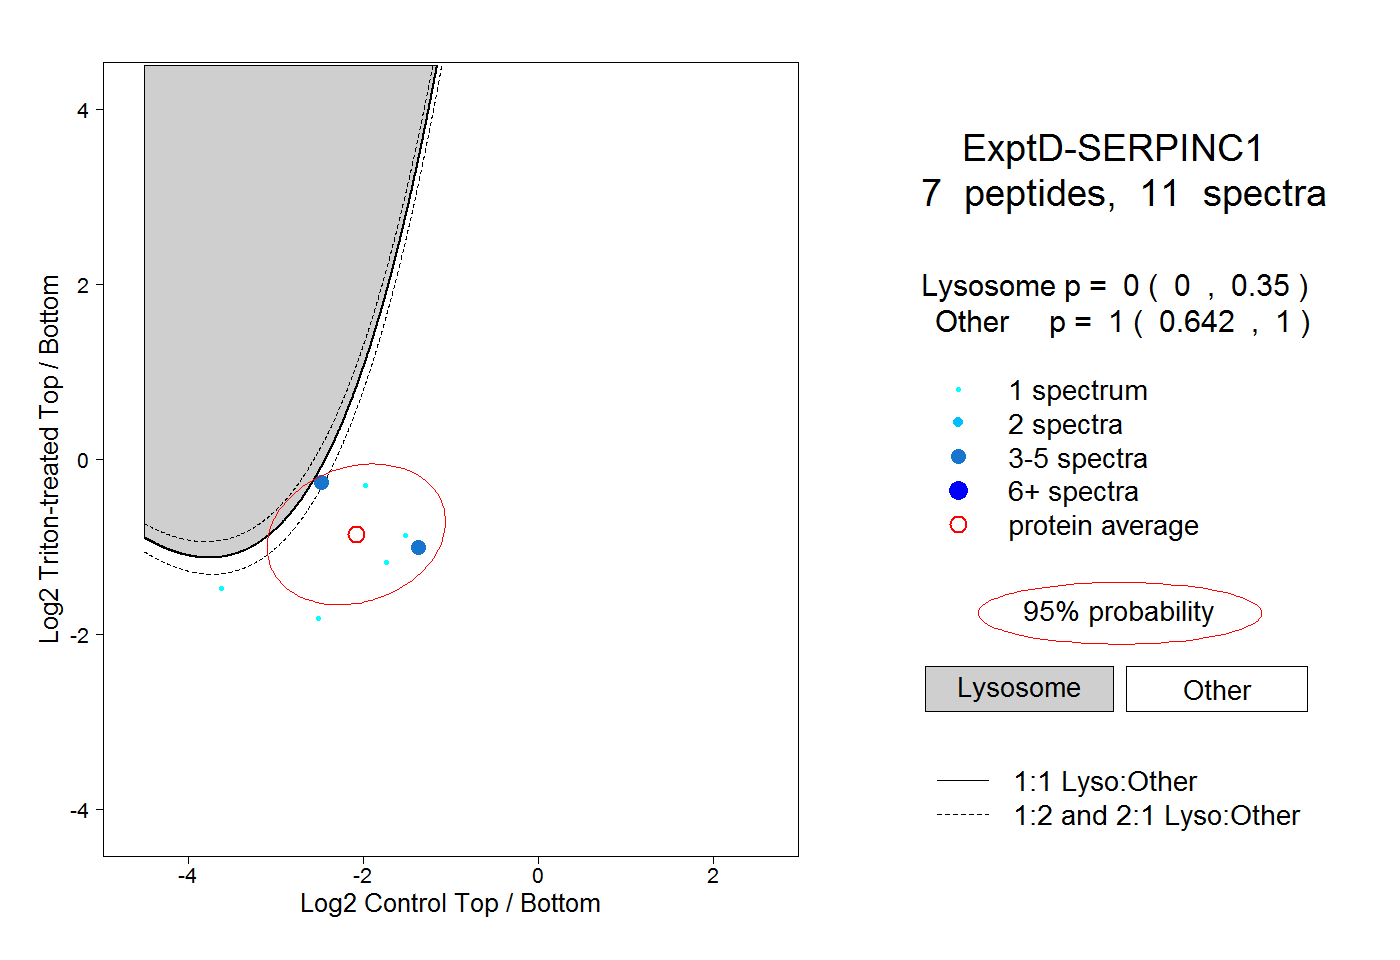
8peptides
spectra

0.000 | 0.000
0.216 | 0.256
0.353 | 0.387
0.000 | 0.005
0.000 | 0.000
0.380 | 0.396
0.000 | 0.000