 1
1peptide
spectrum
NA | NA
NA | NA
NA | NA
NA | NA
NA | NA
NA | NA
NA | NA
NA | NA
3peptides
spectra
0.000 | 0.000
1.000 | 1.000
| Plot | Mito | Lyso | Perox | ER | Golgi | PM | Cytosol | Nucleus | |||||
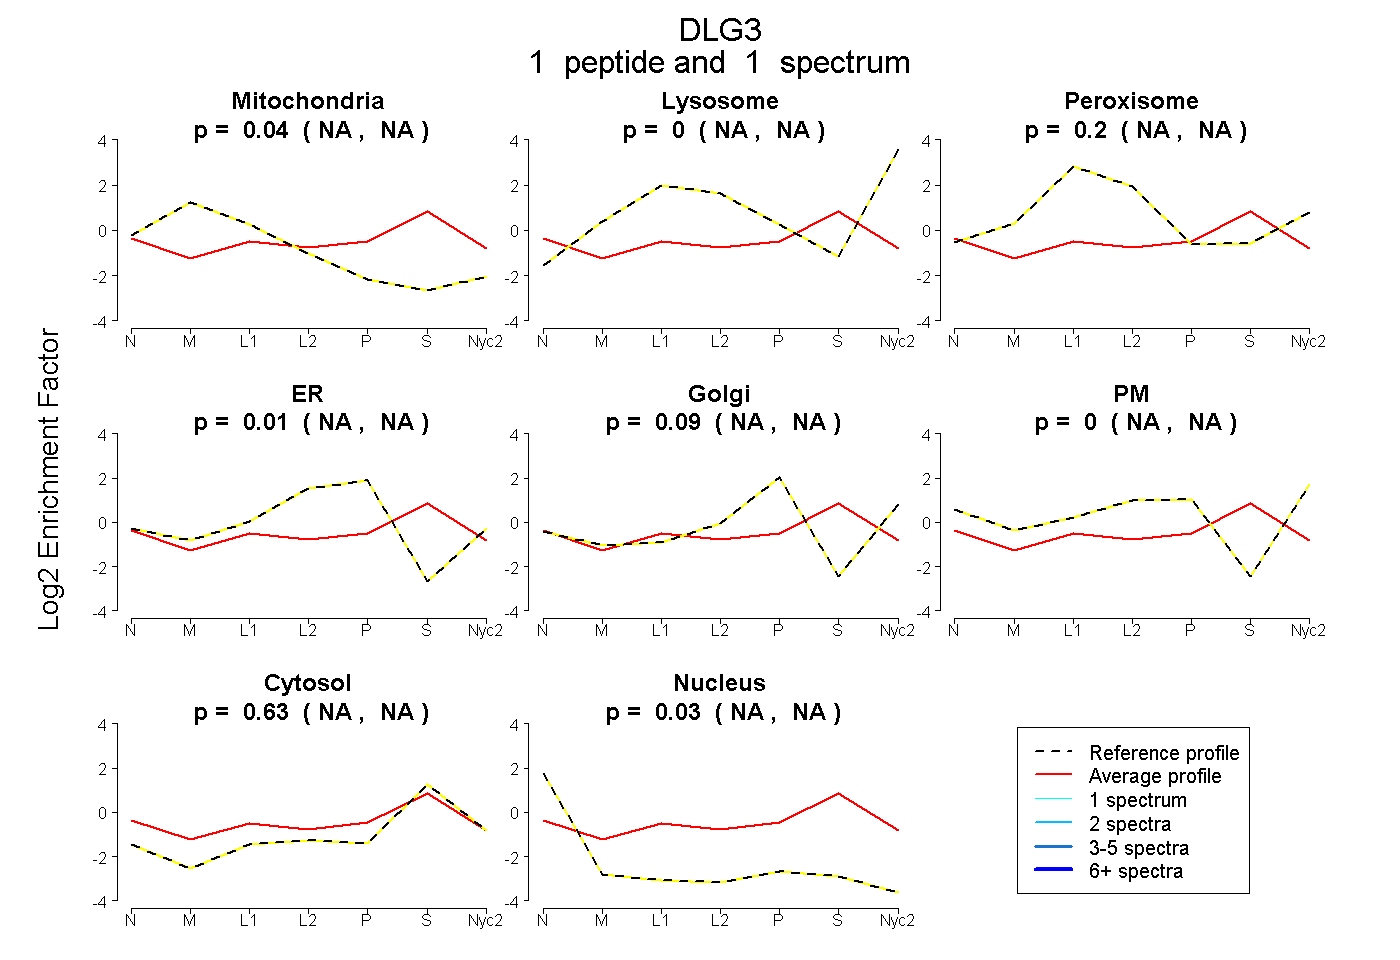
| Expt A |
1 peptide |
1 spectrum |
|
0.042 NA | NA |
0.000 NA | NA |
0.196 NA | NA |
0.005 NA | NA |
0.094 NA | NA |
0.000 NA | NA |
0.631 NA | NA |
0.032 NA | NA |
||
| Plot | Lyso | Other | |||||||||||
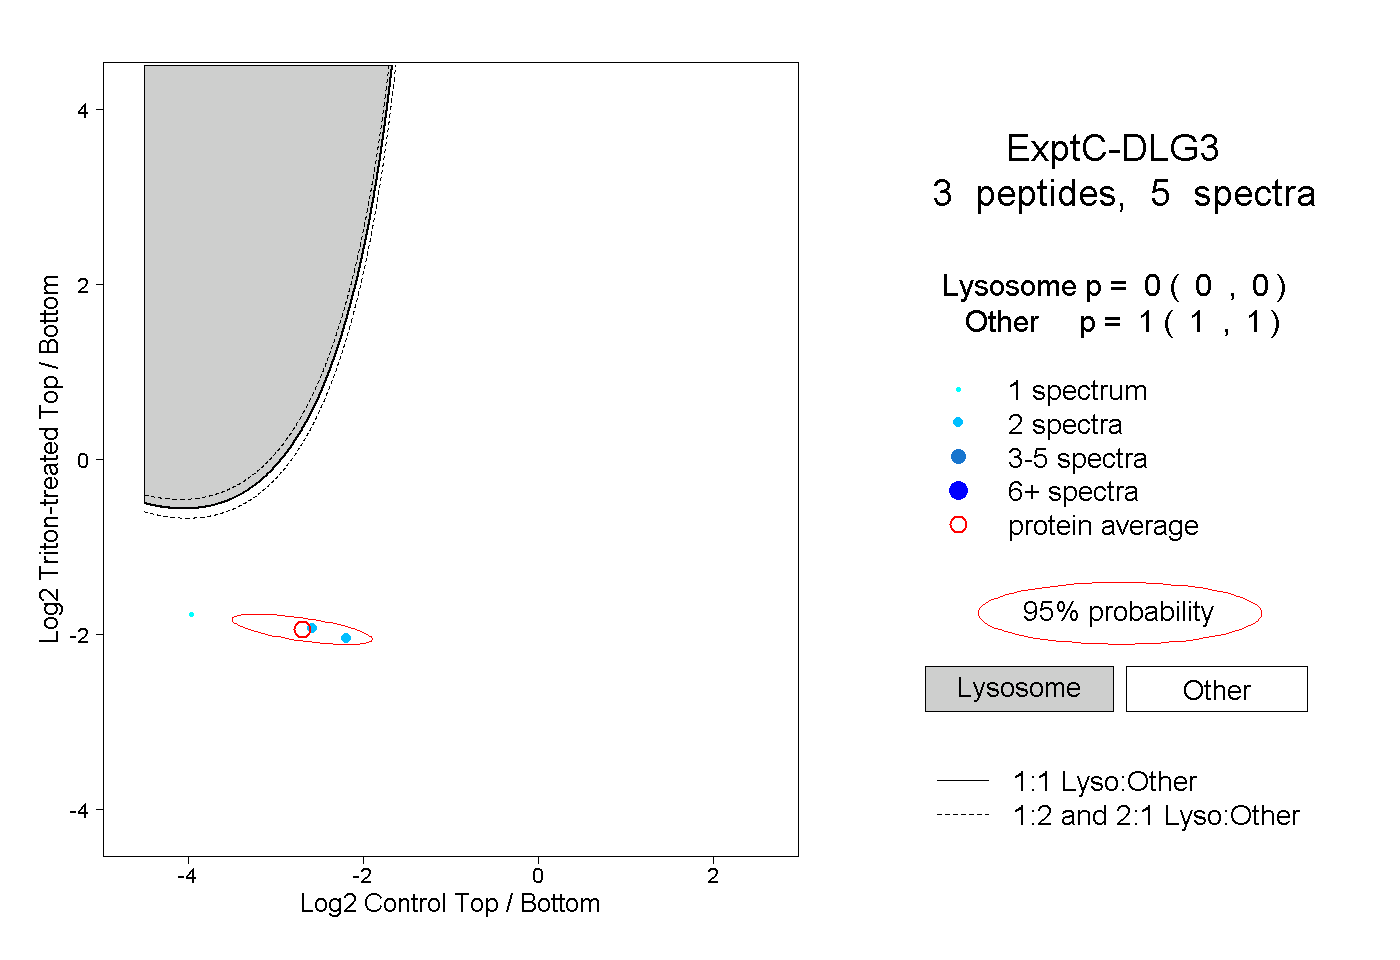
| Expt C |
3 peptides |
5 spectra |
|
0.000 0.000 | 0.000 |
1.000 1.000 | 1.000 |