 6
6peptides
spectra
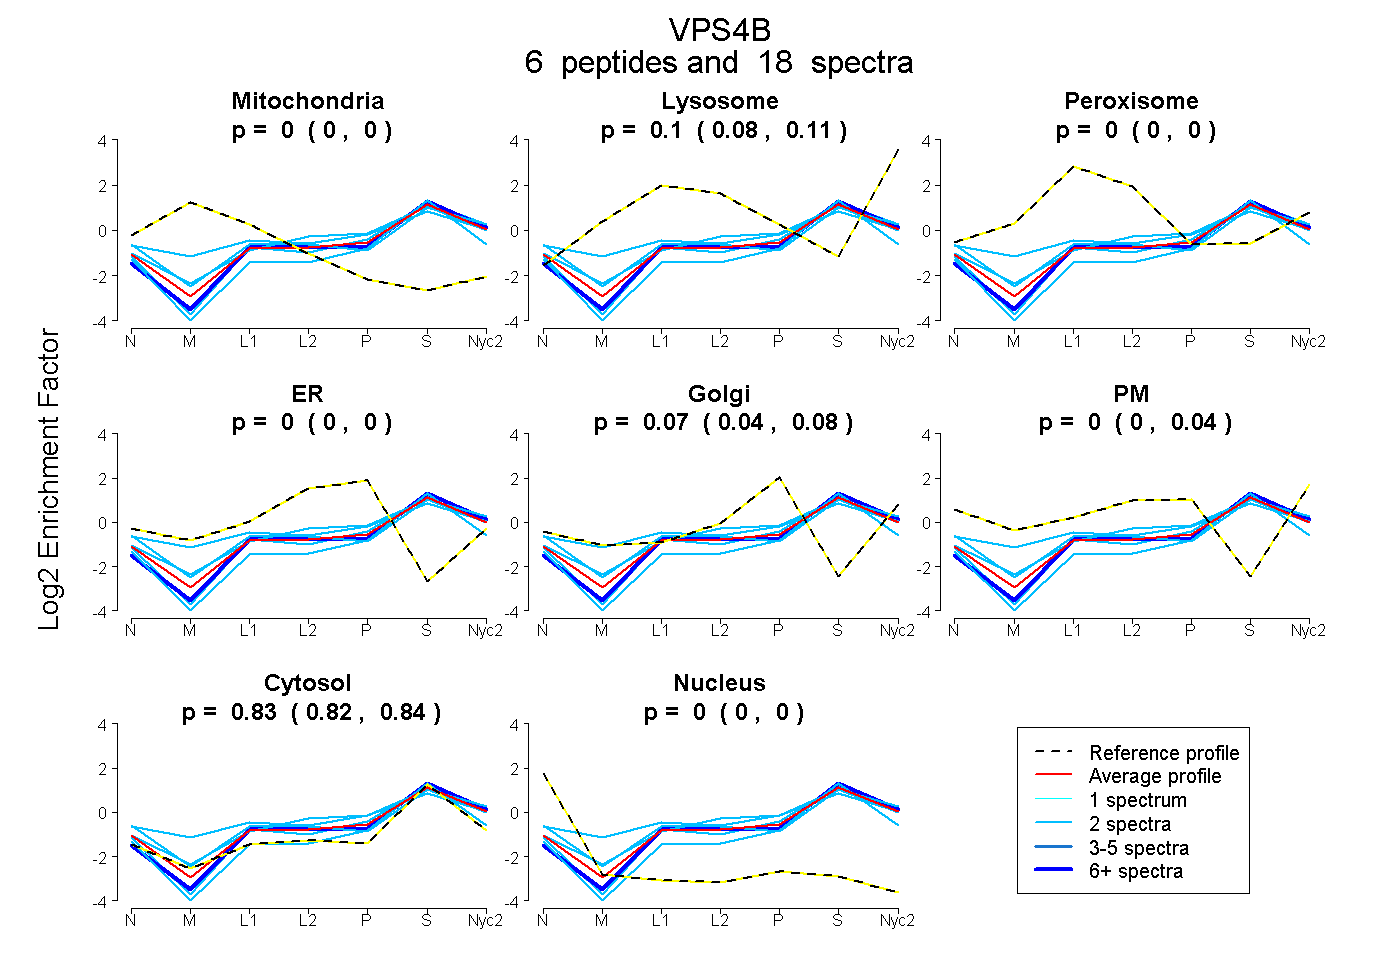
0.000 | 0.000
0.076 | 0.110
0.000 | 0.000
0.000 | 0.000
0.038 | 0.083
0.000 | 0.036
0.816 | 0.840
0.000 | 0.000
2peptides
spectra

0.000 | 0.009
0.250 | 0.464
0.000 | 0.017
0.000 | 0.208
0.000 | 0.135
0.403 | 0.543
0.000 | 0.000
14peptides
spectra
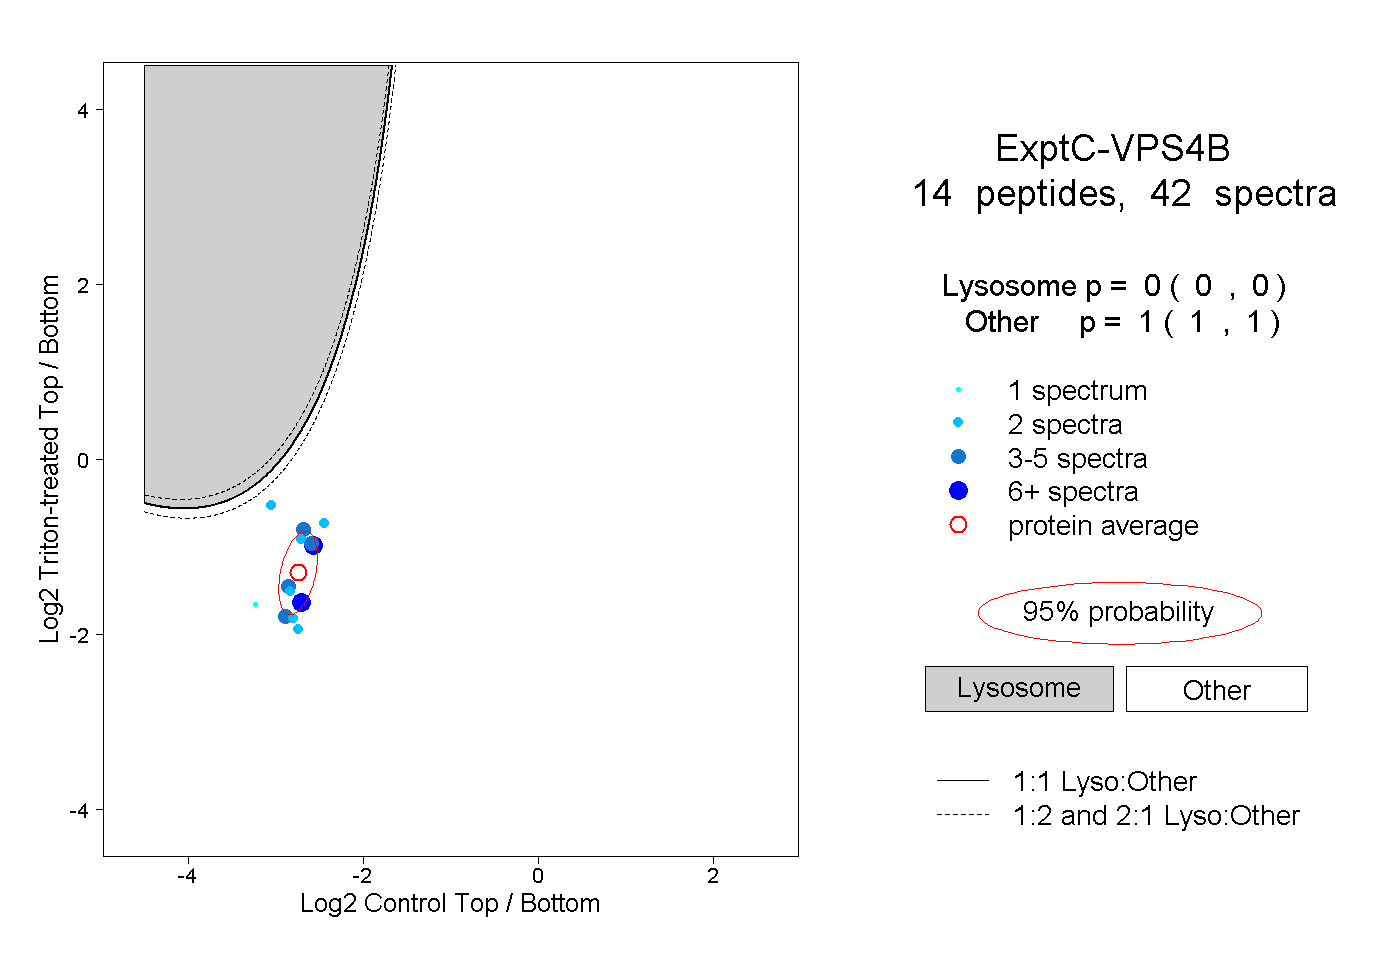
0.000 | 0.000
1.000 | 1.000