 6
6peptides
spectra
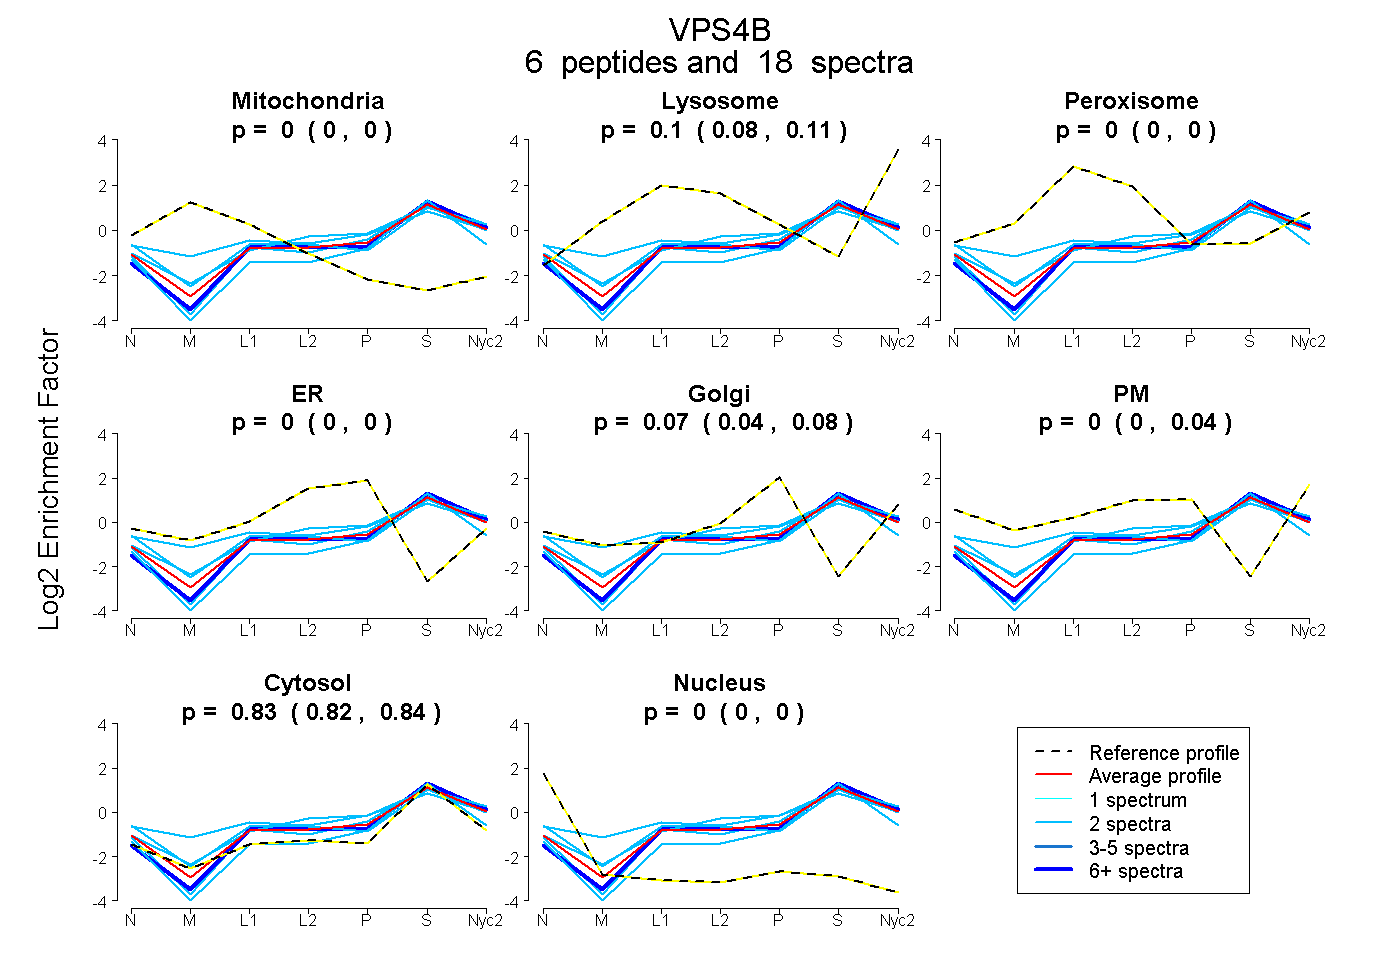
0.000 | 0.000
0.076 | 0.110
0.000 | 0.000
0.000 | 0.000
0.038 | 0.083
0.000 | 0.036
0.816 | 0.840
0.000 | 0.000
| Plot | Mito | Lyso | Perox | ER | Golgi | PM | Cytosol | Nucleus | |||||
| Expt A |
6 peptides |
18 spectra |
|
0.000 0.000 | 0.000 |
0.098 0.076 | 0.110 |
0.000 0.000 | 0.000 |
0.000 0.000 | 0.000 |
0.073 0.038 | 0.083 |
0.000 0.000 | 0.036 |
0.828 0.816 | 0.840 |
0.000 0.000 | 0.000 |
| 2 spectra, EAVILPIK | 0.000 | 0.069 | 0.000 | 0.000 | 0.071 | 0.000 | 0.860 | 0.000 | ||
| 2 spectra, WSDVAGLEGAK | 0.000 | 0.091 | 0.023 | 0.000 | 0.000 | 0.112 | 0.774 | 0.000 | ||
| 2 spectra, YEAQGDK | 0.000 | 0.117 | 0.000 | 0.104 | 0.042 | 0.000 | 0.737 | 0.000 | ||
| 2 spectra, VQSATHFK | 0.000 | 0.044 | 0.171 | 0.000 | 0.122 | 0.057 | 0.606 | 0.000 | ||
| 2 spectra, IYIPLPEAHAR | 0.000 | 0.000 | 0.000 | 0.000 | 0.000 | 0.000 | 1.000 | 0.000 | ||
| 8 spectra, FPHLFTGK | 0.000 | 0.109 | 0.000 | 0.000 | 0.000 | 0.000 | 0.891 | 0.000 |
| Plot | Mito | Lyso or Perox | ER | Golgi | PM | Cytosol | Nucleus | ||||||
| Expt B |
2 peptides |
3 spectra |
 |
0.000 0.000 | 0.009 |
0.383 0.250 | 0.464 |
0.000 0.000 | 0.017 |
0.139 0.000 | 0.208 |
0.000 0.000 | 0.135 |
0.478 0.403 | 0.543 |
0.000 0.000 | 0.000 |
|||
| Plot | Lyso | Other | |||||||||||
| Expt C |
14 peptides |
42 spectra |
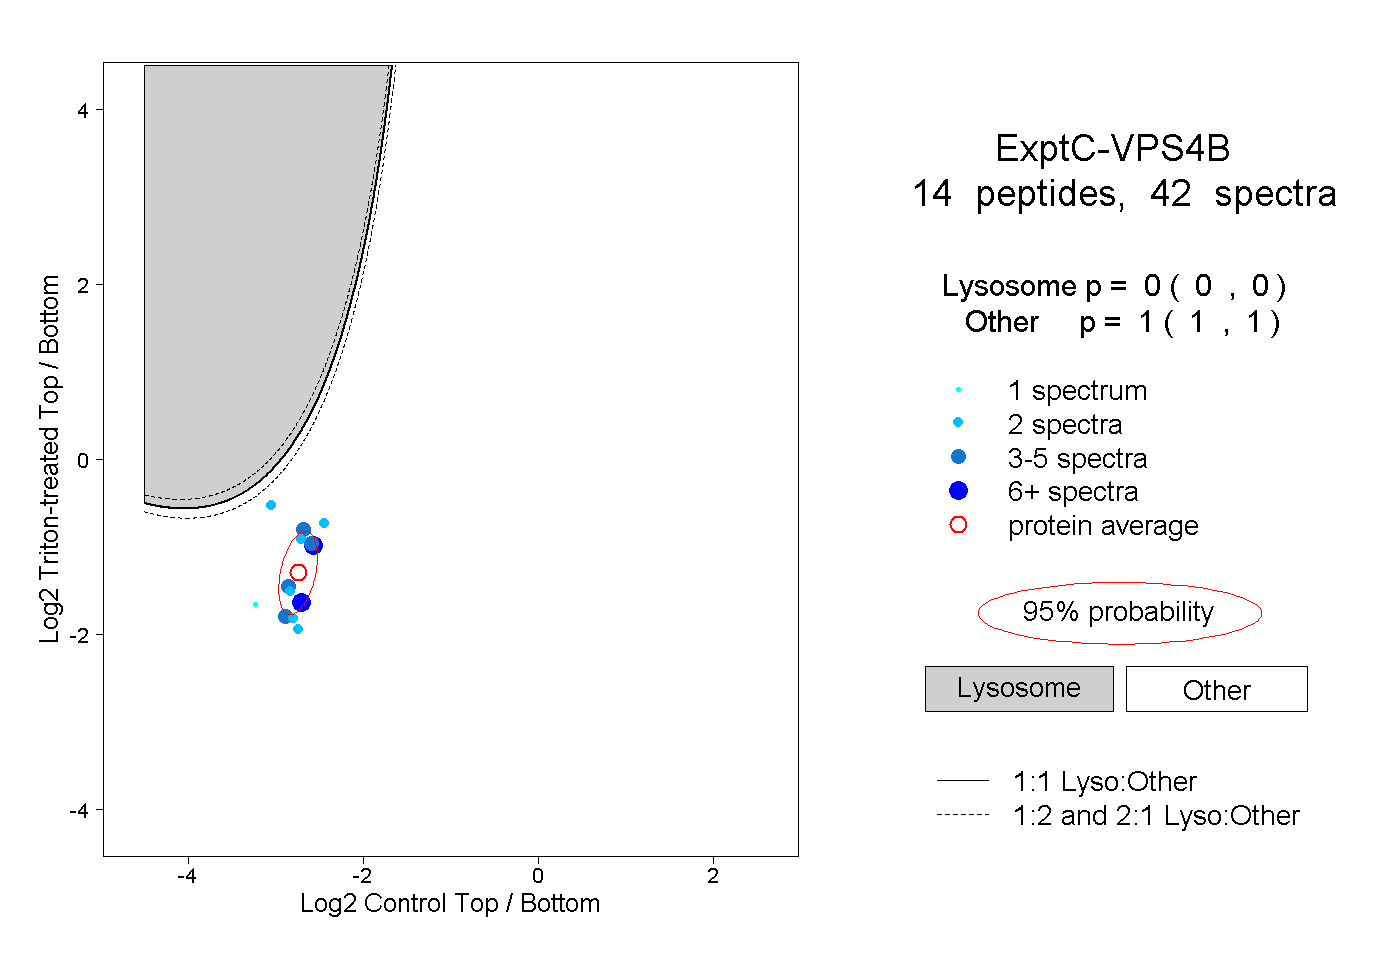 |
0.000 0.000 | 0.000 |
1.000 1.000 | 1.000 |