 4
4peptides
spectra
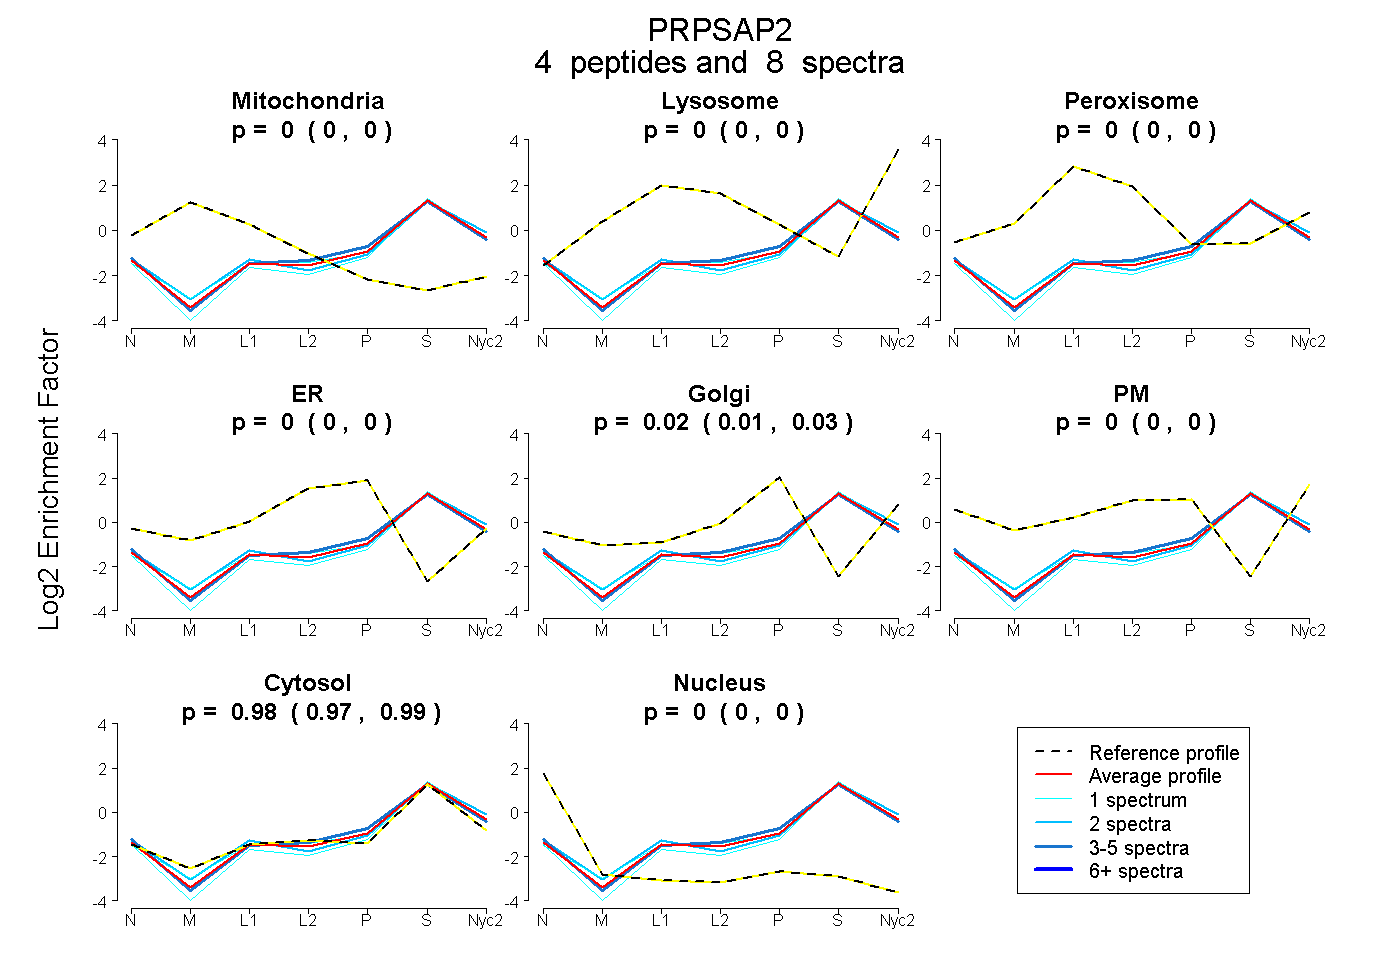
0.000 | 0.000
0.000 | 0.000
0.000 | 0.000
0.000 | 0.000
0.005 | 0.028
0.000 | 0.000
0.970 | 0.993
0.000 | 0.000
2peptides
spectra

0.000 | 0.000
0.000 | 0.125
0.000 | 0.000
0.106 | 0.190
0.000 | 0.018
0.745 | 0.804
0.000 | 0.000
3peptides
spectra
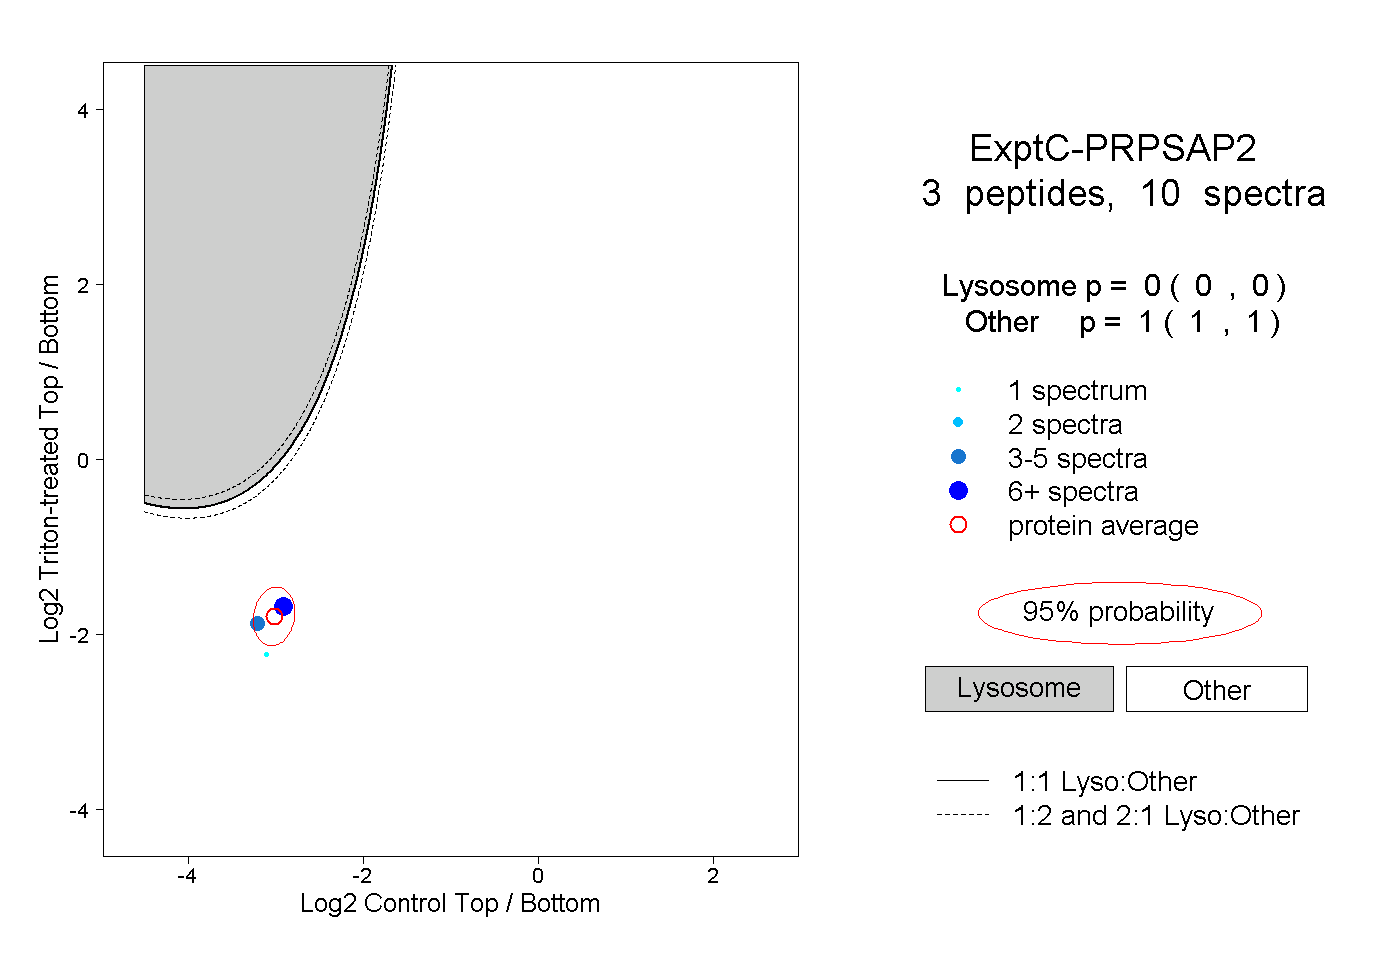
0.000 | 0.000
1.000 | 1.000
1peptide
spectrum
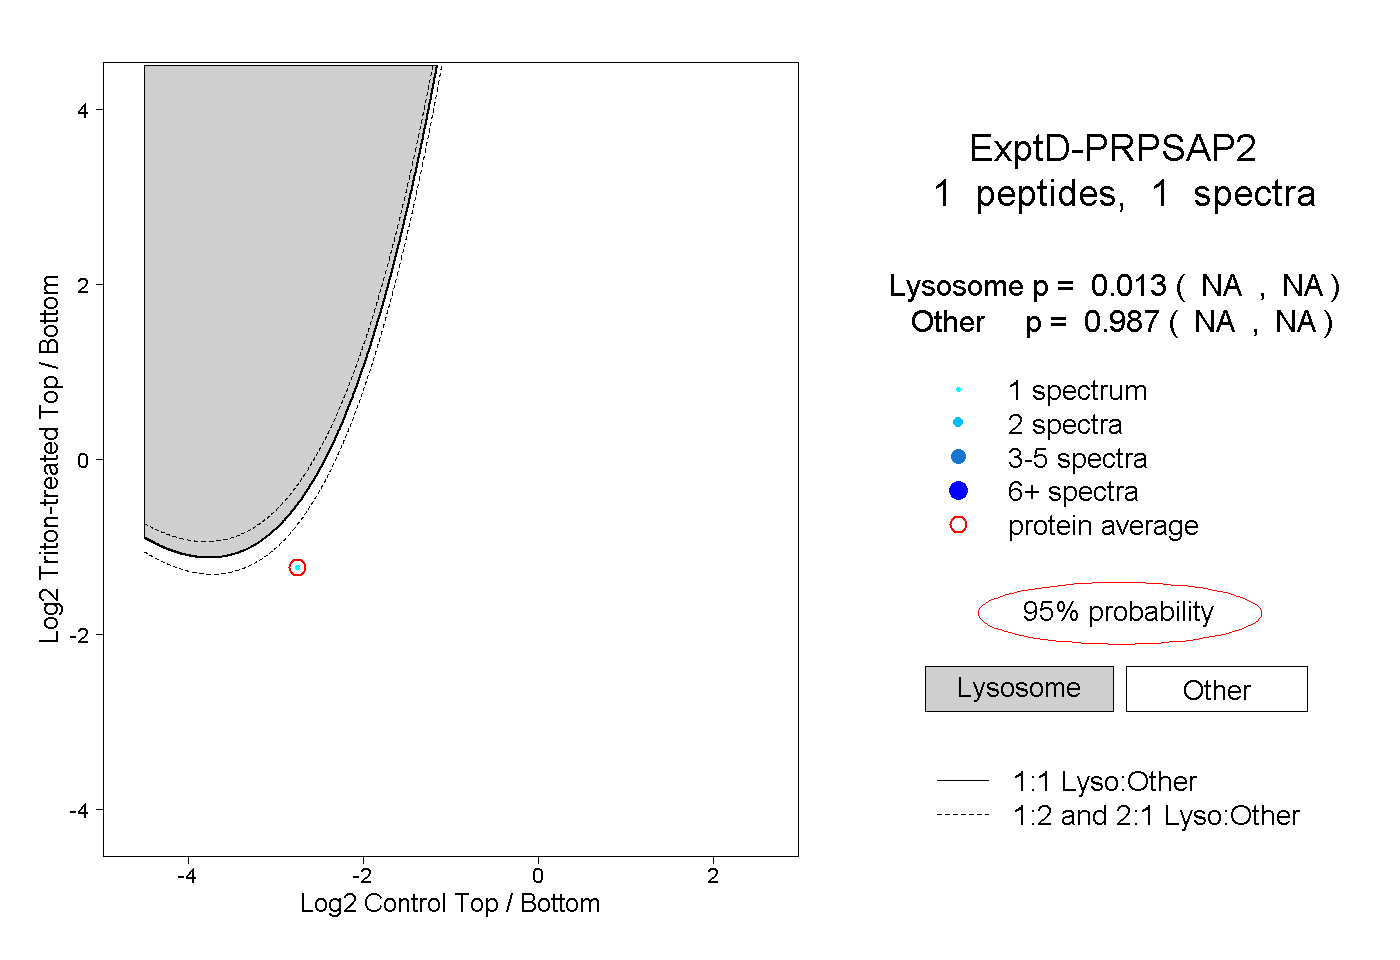
NA | NA
NA | NA