 10
10peptides
spectra
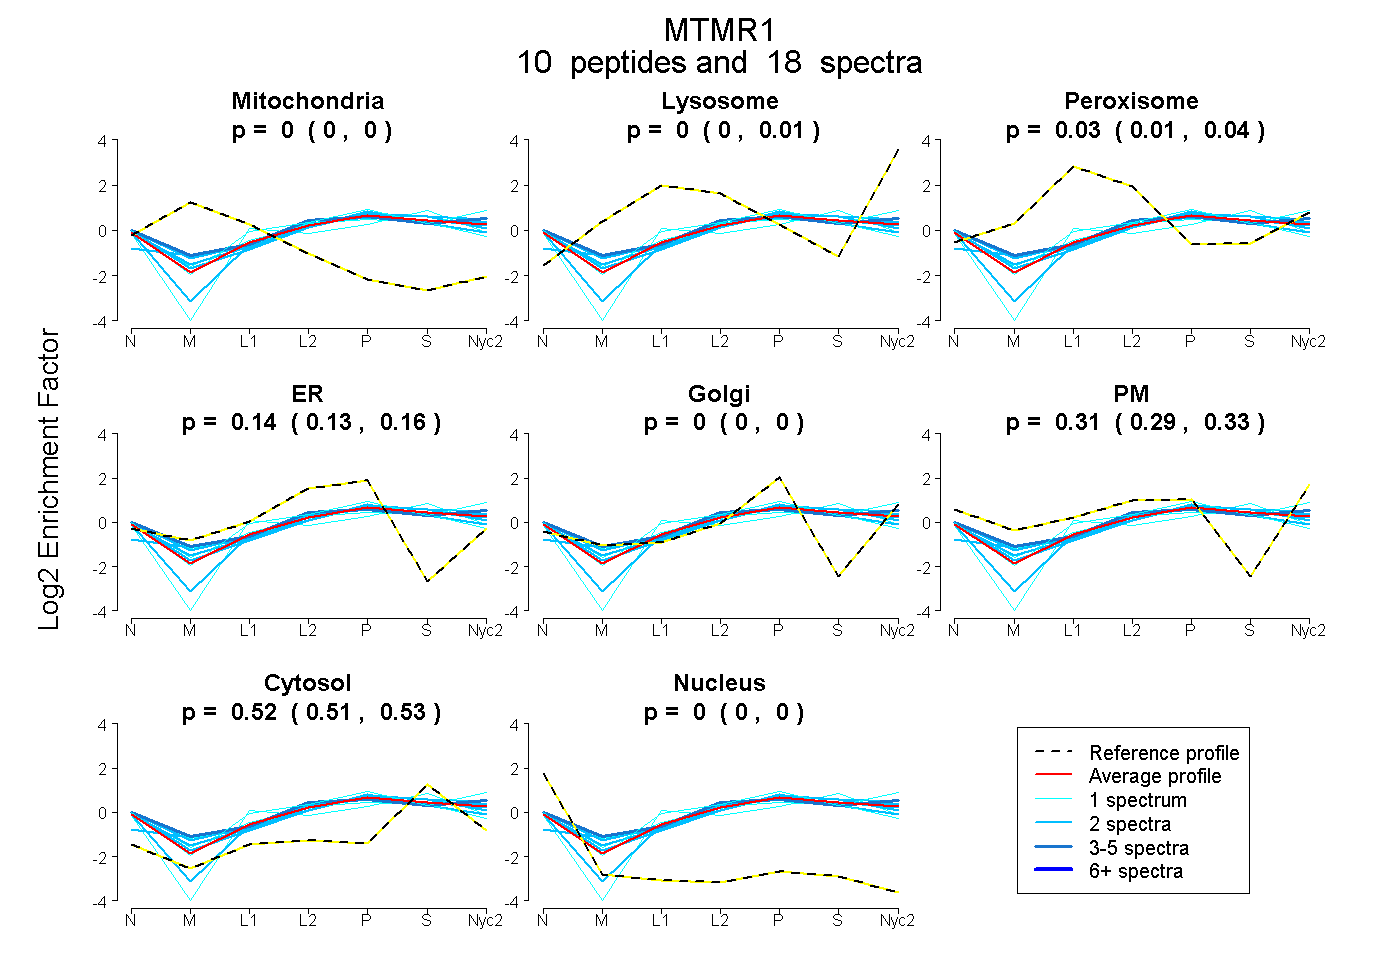
0.000 | 0.000
0.000 | 0.010
0.009 | 0.036
0.126 | 0.157
0.000 | 0.002
0.291 | 0.328
0.509 | 0.528
0.000 | 0.000
1peptide
spectra
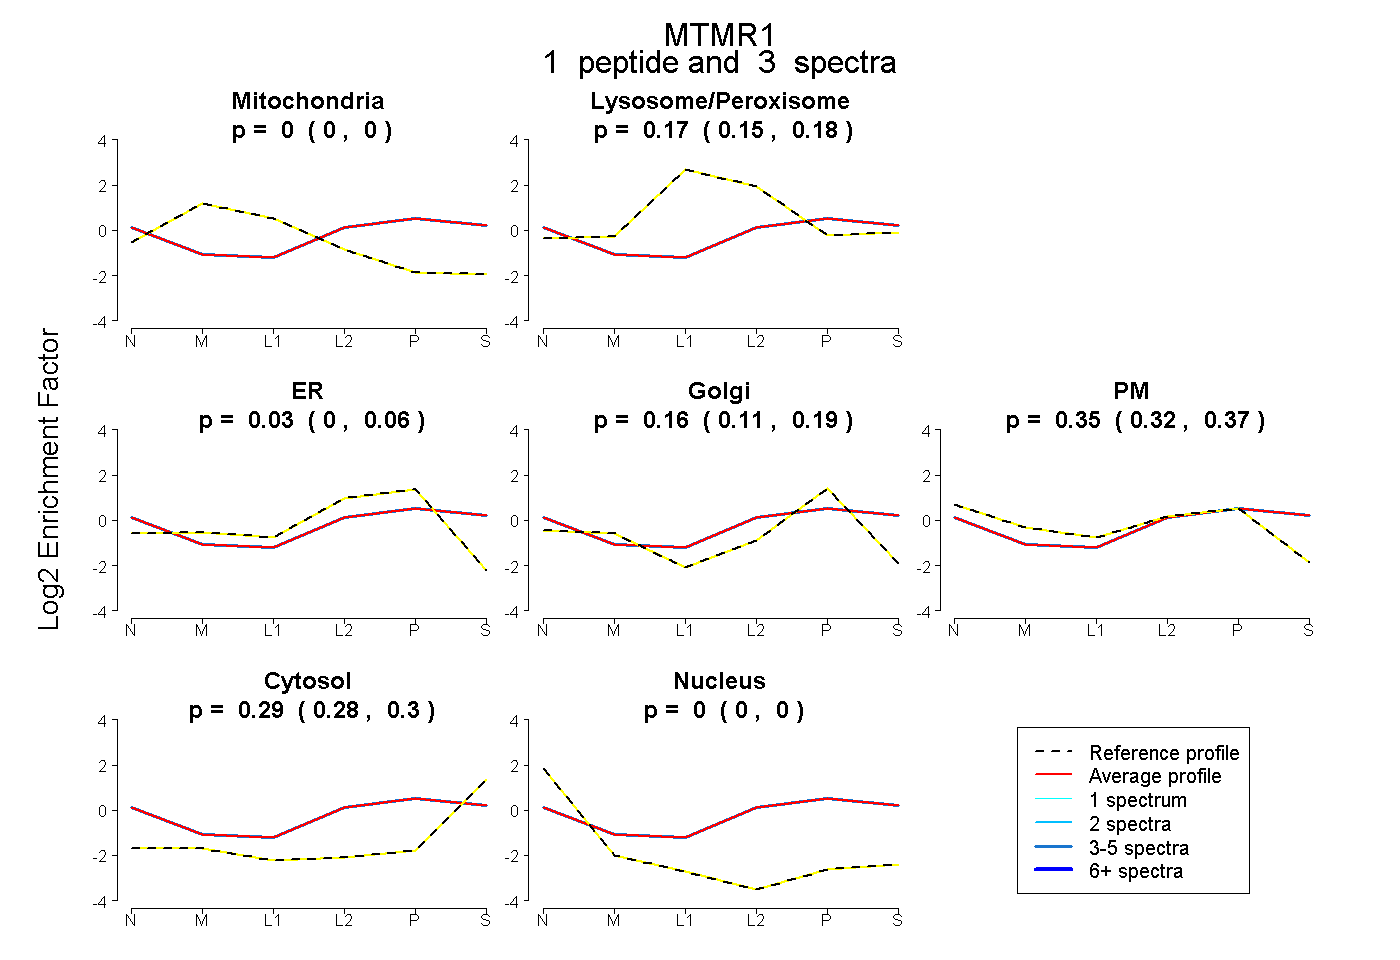
0.000 | 0.000
0.152 | 0.183
0.000 | 0.063
0.115 | 0.193
0.319 | 0.374
0.279 | 0.304
0.000 | 0.000
9peptides
spectra
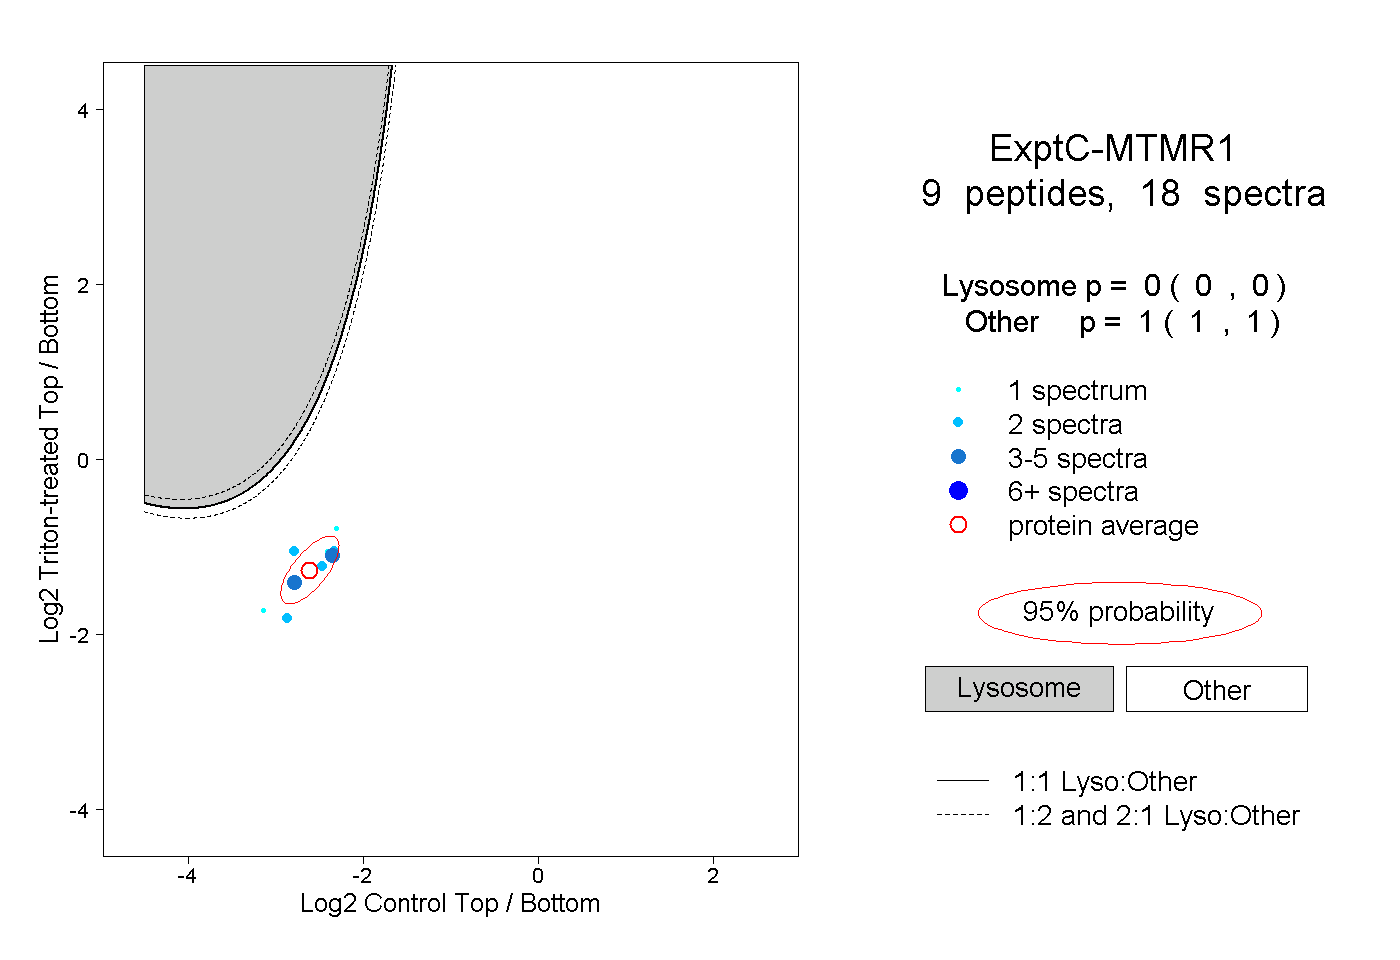
0.000 | 0.000
1.000 | 1.000
2peptides
spectra
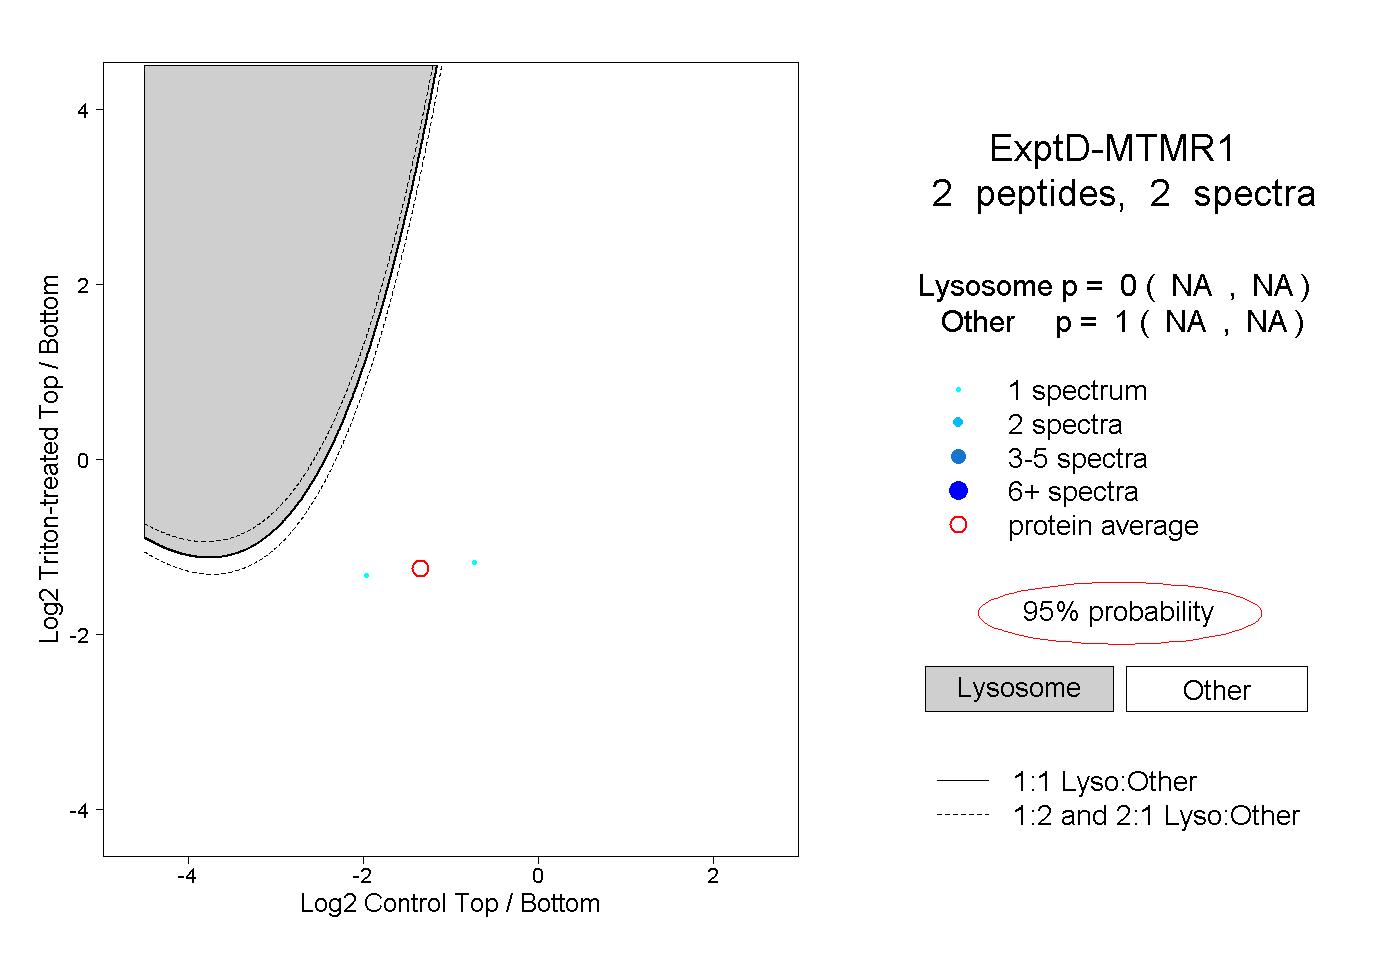
NA | NA
NA | NA