11
11peptides
spectra
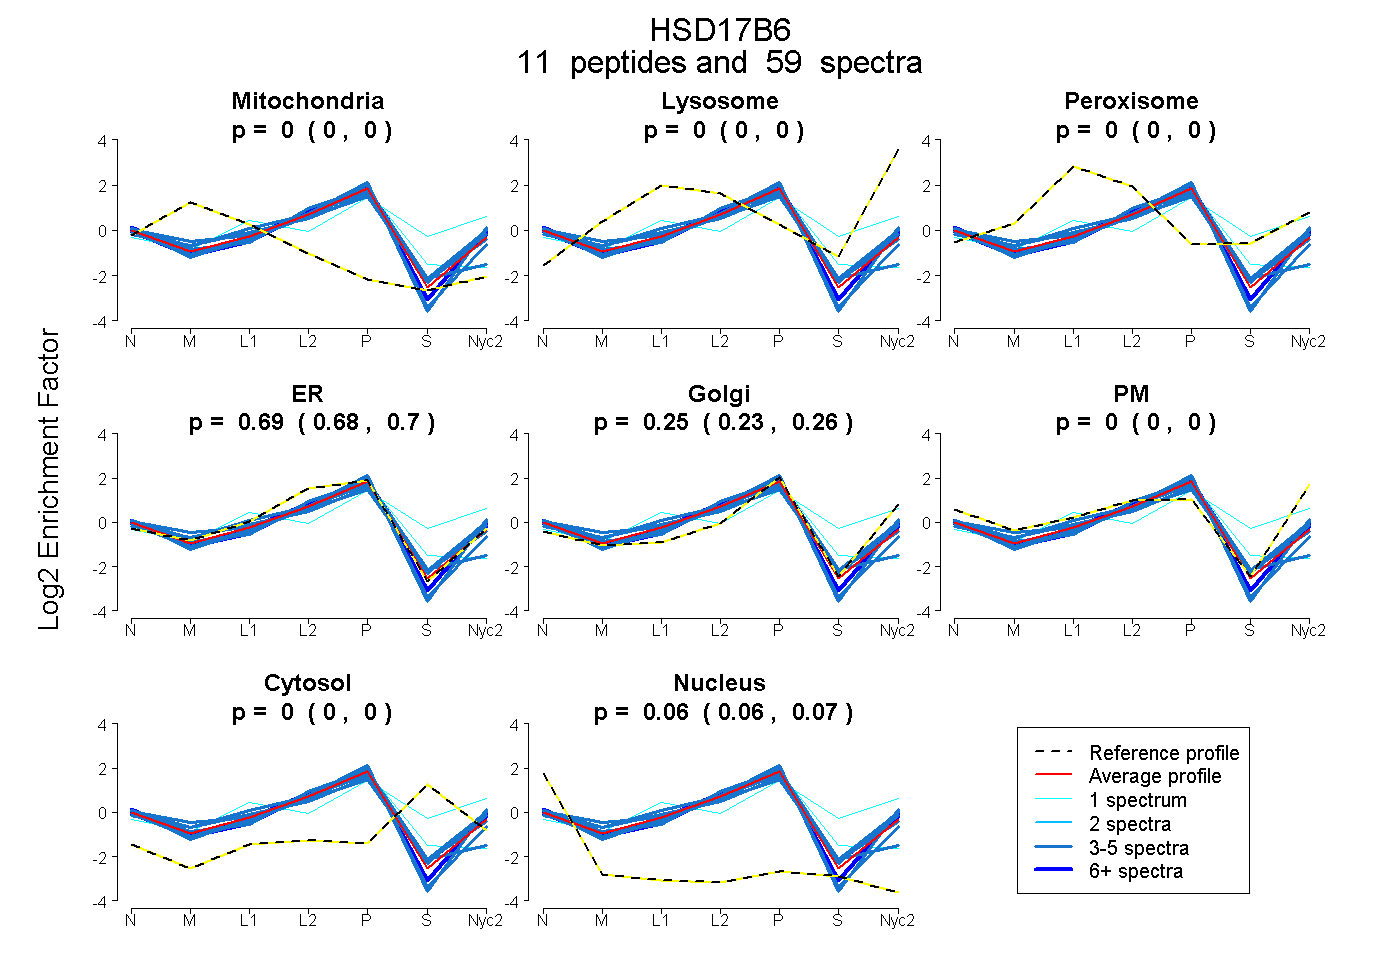
0.000 | 0.000
0.000 | 0.000
0.000 | 0.000
0.677 | 0.702
0.229 | 0.259
0.000 | 0.000
0.000 | 0.000
0.060 | 0.066
9peptides
spectra
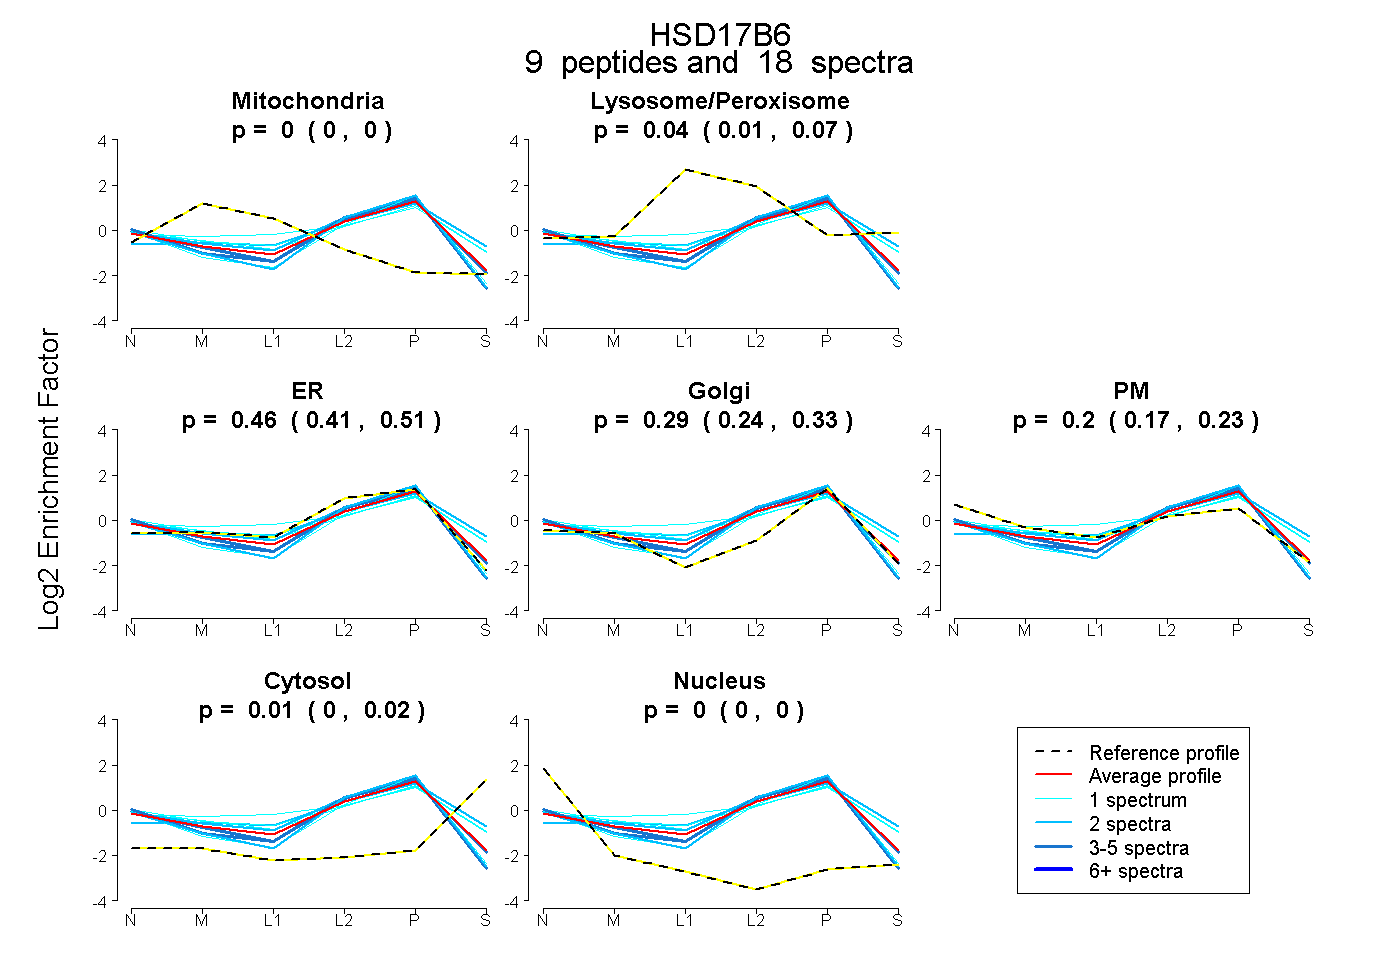
0.000 | 0.000
0.006 | 0.071
0.409 | 0.508
0.235 | 0.327
0.171 | 0.234
0.000 | 0.018
0.000 | 0.000