RBM47
[ENSRNOP00000003327]
Main page
| | | Plot |
Mito |
Lyso |
|
Perox |
ER |
Golgi |
PM |
Cytosol |
Nucleus |
|
| Expt A |
 11
11
peptides |
22
spectra |
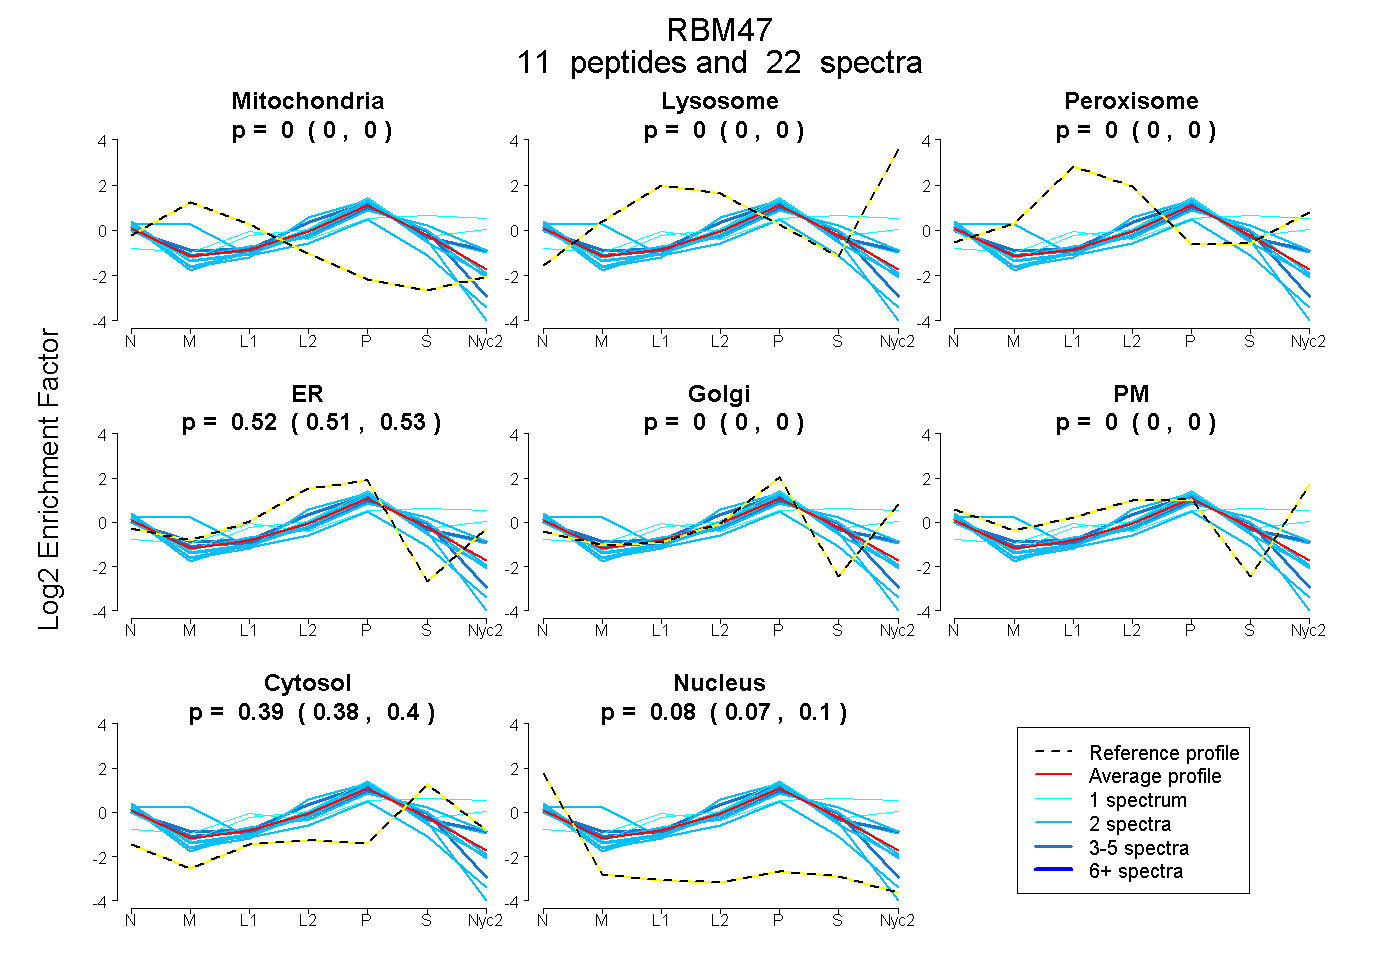 |
0.000
0.000 | 0.000 |
0.000
0.000 | 0.000 |
|
0.000
0.000 | 0.000 |
0.522
0.513 | 0.529 |
0.000
0.000 | 0.000 |
0.000
0.000 | 0.000 |
0.393
0.379 | 0.404 |
0.085
0.071 | 0.097 |
|
| | | Plot |
Mito |
|
Lyso or Perox |
|
ER |
Golgi |
PM |
Cytosol |
Nucleus |
|
| Expt B |
4
peptides |
7
spectra |
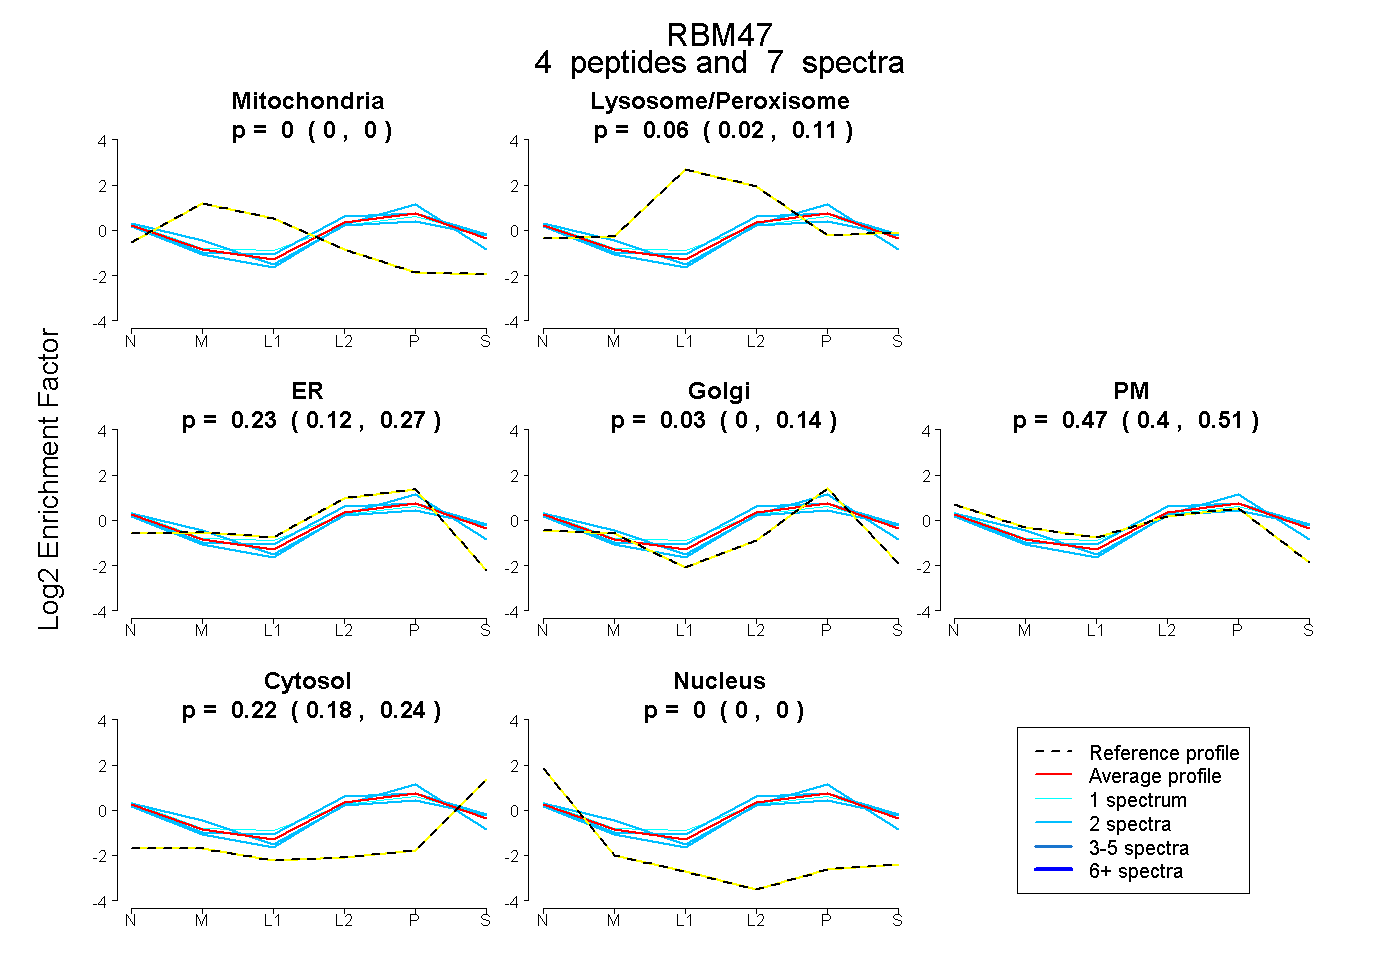 |
0.000
0.000 | 0.000 |
|
0.057
0.023 | 0.107 |
|
0.226
0.119 | 0.272 |
0.030
0.000 | 0.140 |
0.468
0.397 | 0.505 |
0.218
0.177 | 0.237 |
0.000
0.000 | 0.000 |
|
| 1 spectrum, GCEVFVGK |
0.000 |
|
0.185 |
|
0.000 |
0.159 |
0.469 |
0.186 |
0.000 |
|
| 2 spectra, GEILEEIAK |
0.000 |
|
0.000 |
|
0.317 |
0.229 |
0.307 |
0.147 |
0.000 |
|
| 2 spectra, LFIGGIPK |
0.000 |
|
0.127 |
|
0.277 |
0.000 |
0.375 |
0.222 |
0.000 |
|
| 2 spectra, LLGVCCSVDNCR |
0.000 |
|
0.030 |
|
0.092 |
0.000 |
0.619 |
0.259 |
0.000 |
|
| | | Plot |
|
Lyso |
|
|
|
|
|
|
|
Other |
| Expt C |
5
peptides |
20
spectra |
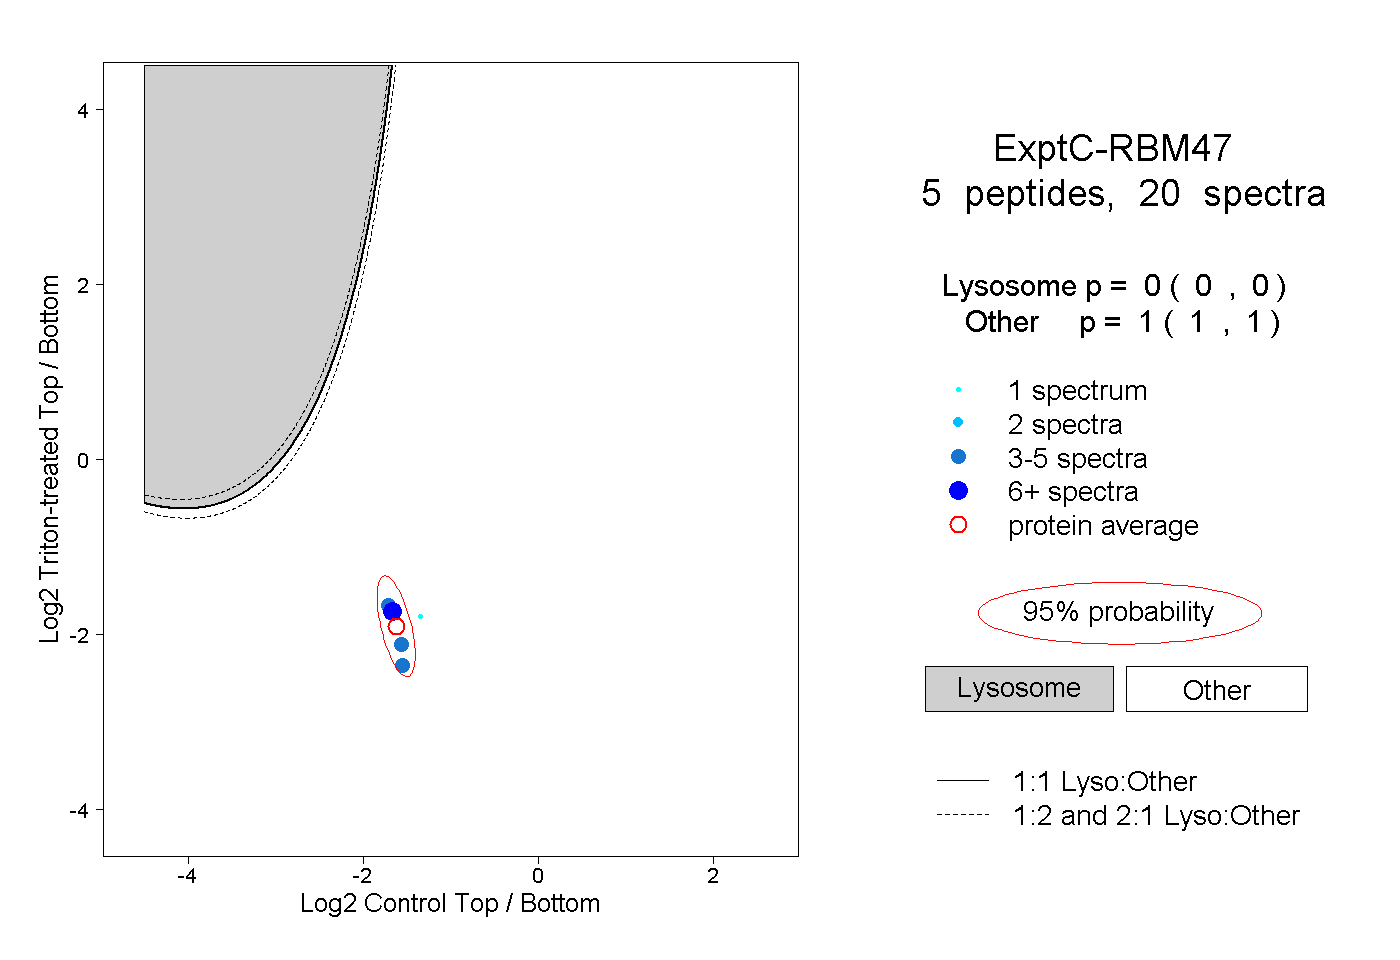 |
|
0.000
0.000 | 0.000 |
|
|
|
|
|
|
|
1.000
1.000 | 1.000 |
| | | Plot |
|
Lyso |
|
|
|
|
|
|
|
Other |
| Expt D |
3
peptides |
7
spectra |
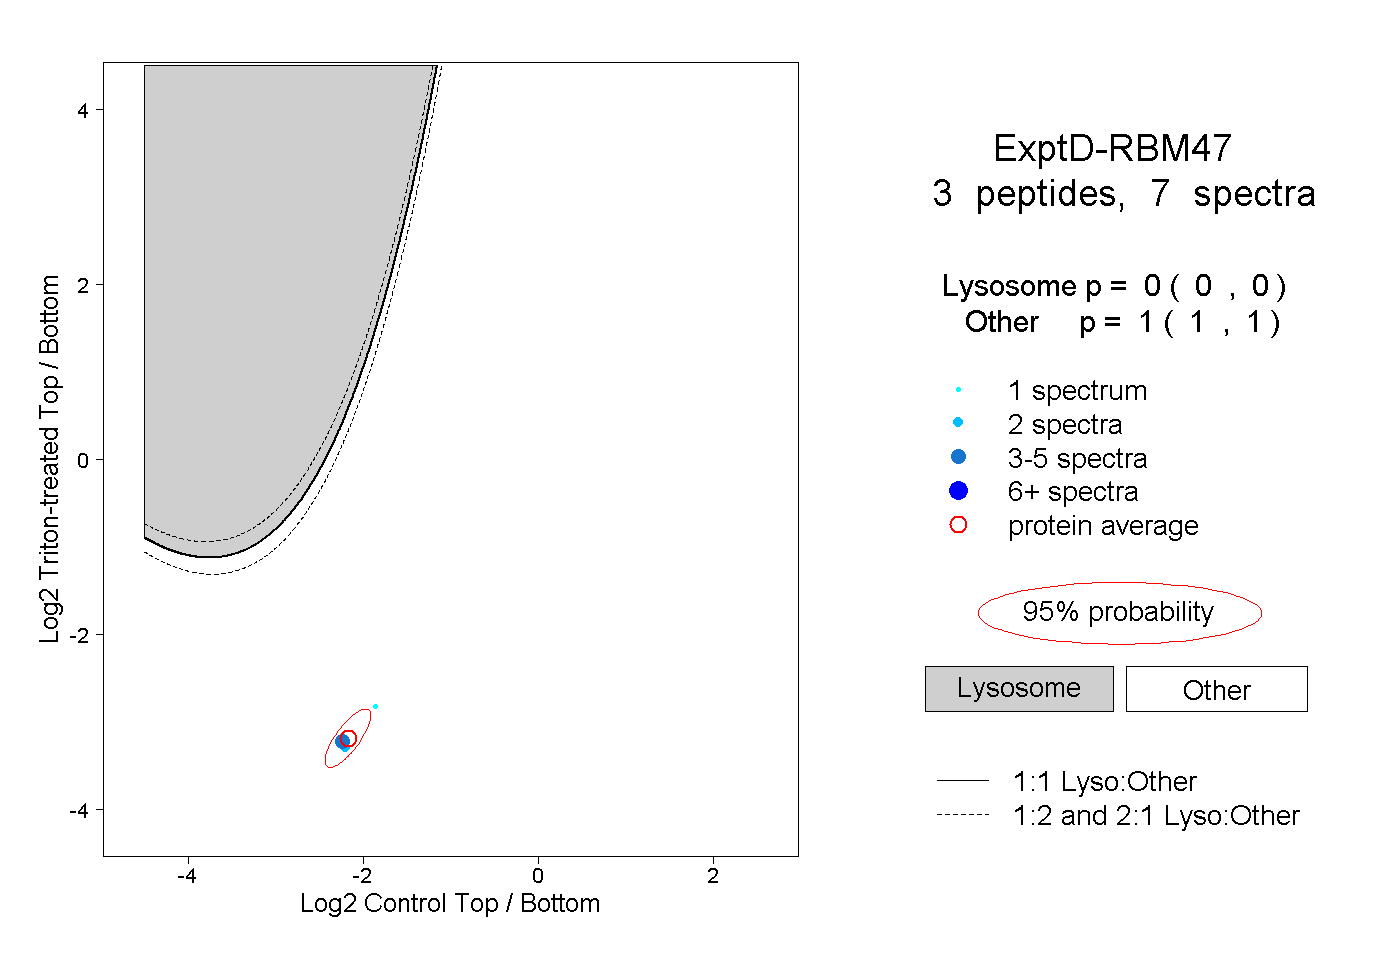 |
|
0.000
0.000 | 0.000 |
|
|
|
|
|
|
|
1.000
1.000 | 1.000 |