 2
2peptides
spectra
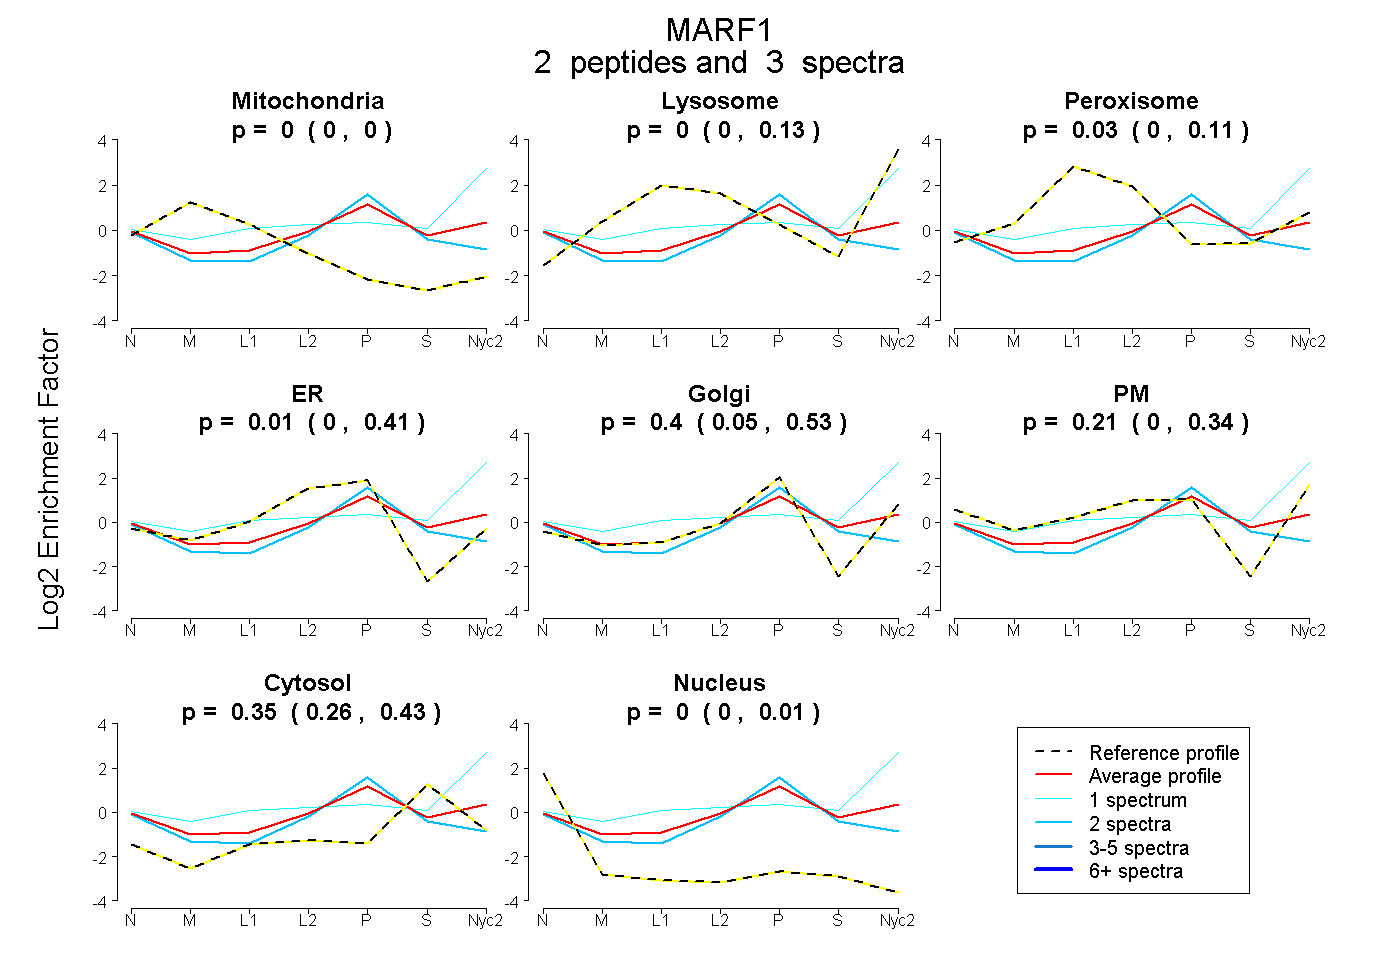
0.000 | 0.000
0.000 | 0.135
0.000 | 0.112
0.000 | 0.410
0.048 | 0.531
0.000 | 0.343
0.256 | 0.432
0.000 | 0.009
1peptide
spectrum
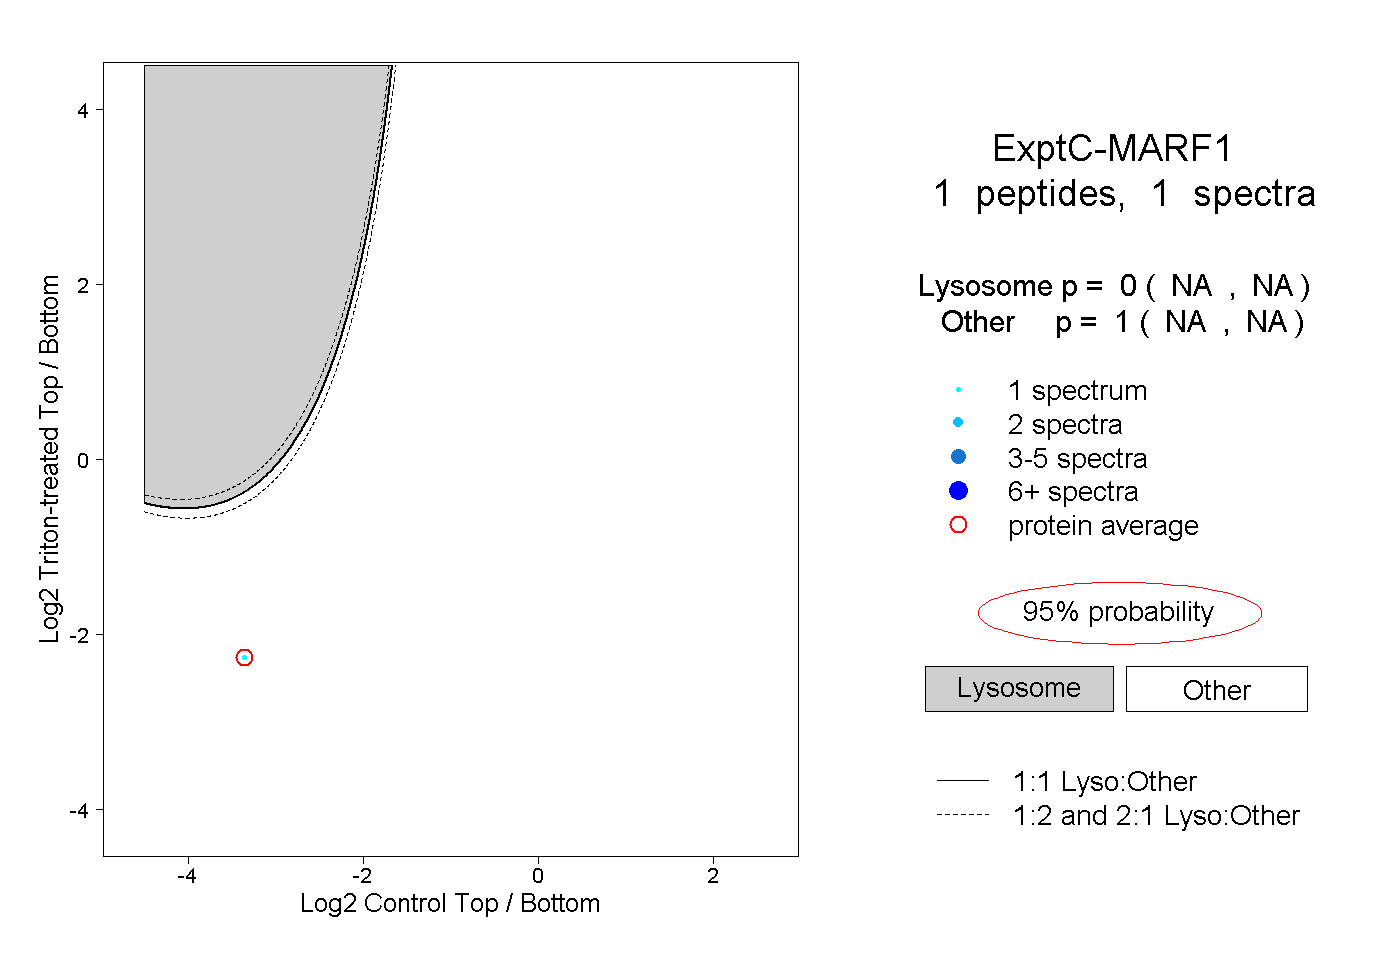
NA | NA
NA | NA
| Plot | Mito | Lyso | Perox | ER | Golgi | PM | Cytosol | Nucleus | |||||
| Expt A |
2 peptides |
3 spectra |
|
0.000 0.000 | 0.000 |
0.000 0.000 | 0.135 |
0.029 0.000 | 0.112 |
0.009 0.000 | 0.410 |
0.398 0.048 | 0.531 |
0.212 0.000 | 0.343 |
0.352 0.256 | 0.432 |
0.000 0.000 | 0.009 |
||
| Plot | Lyso | Other | |||||||||||
| Expt C |
1 peptide |
1 spectrum |
|
0.000 NA | NA |
1.000 NA | NA |