 2
2peptides
spectra
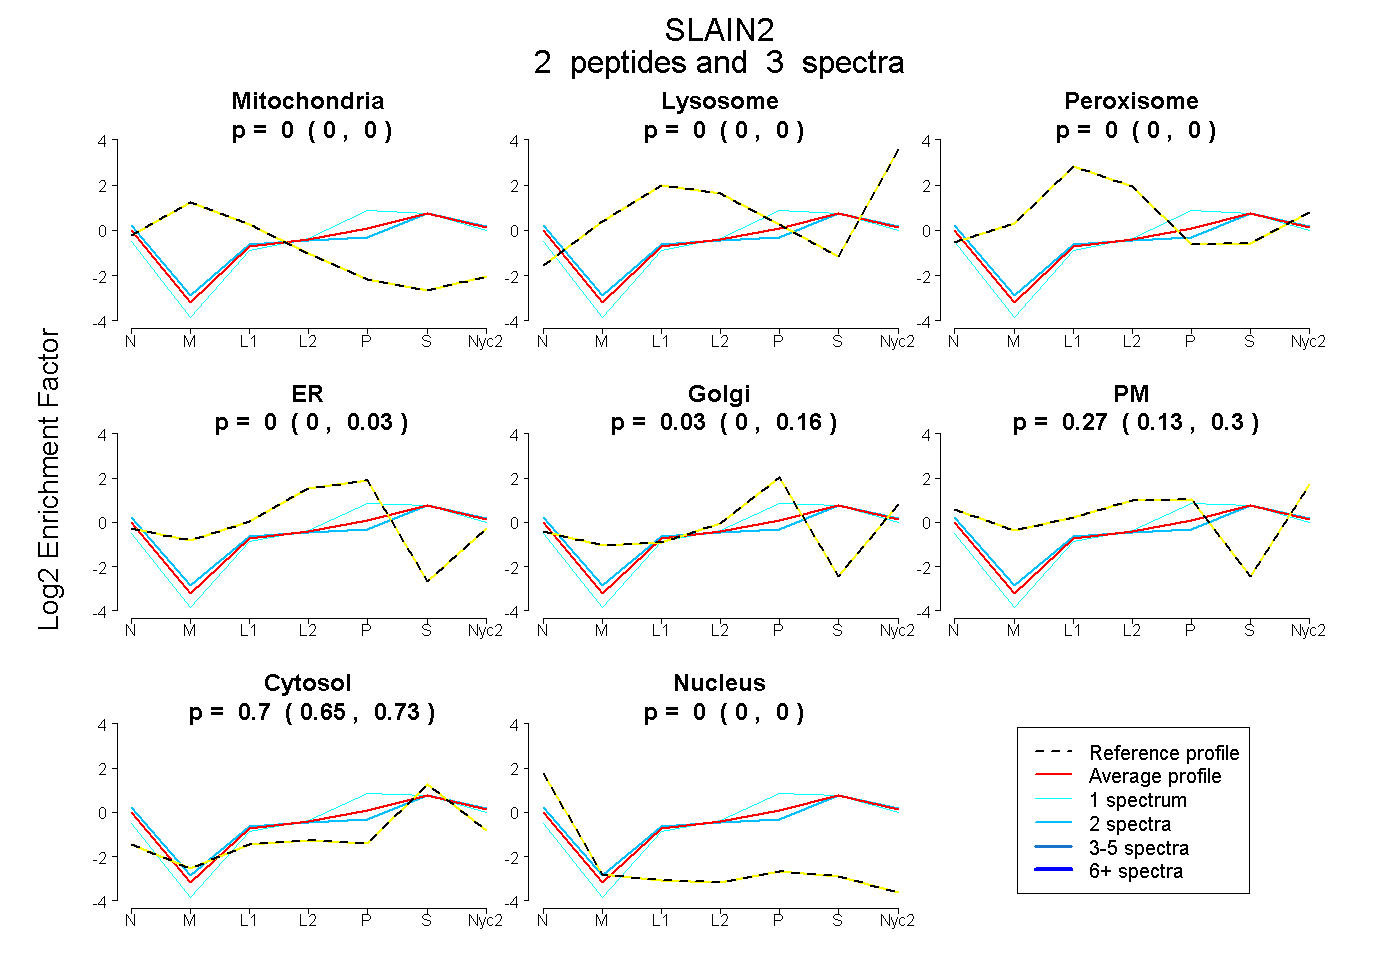
0.000 | 0.000
0.000 | 0.000
0.000 | 0.000
0.000 | 0.027
0.000 | 0.163
0.134 | 0.303
0.649 | 0.734
0.000 | 0.000
| Plot | Mito | Lyso | Perox | ER | Golgi | PM | Cytosol | Nucleus | |||||
| Expt A |
2 peptides |
3 spectra |
|
0.000 0.000 | 0.000 |
0.000 0.000 | 0.000 |
0.000 0.000 | 0.000 |
0.000 0.000 | 0.027 |
0.031 0.000 | 0.163 |
0.267 0.134 | 0.303 |
0.703 0.649 | 0.734 |
0.000 0.000 | 0.000 |
| 1 spectrum, SPAAPSPLALR | 0.000 | 0.000 | 0.000 | 0.045 | 0.295 | 0.000 | 0.661 | 0.000 | ||
| 2 spectra, QEYAATTSR | 0.000 | 0.000 | 0.000 | 0.000 | 0.000 | 0.304 | 0.696 | 0.000 |
| Plot | Lyso | Other | |||||||||||
| Expt C |
1 peptide |
2 spectra |
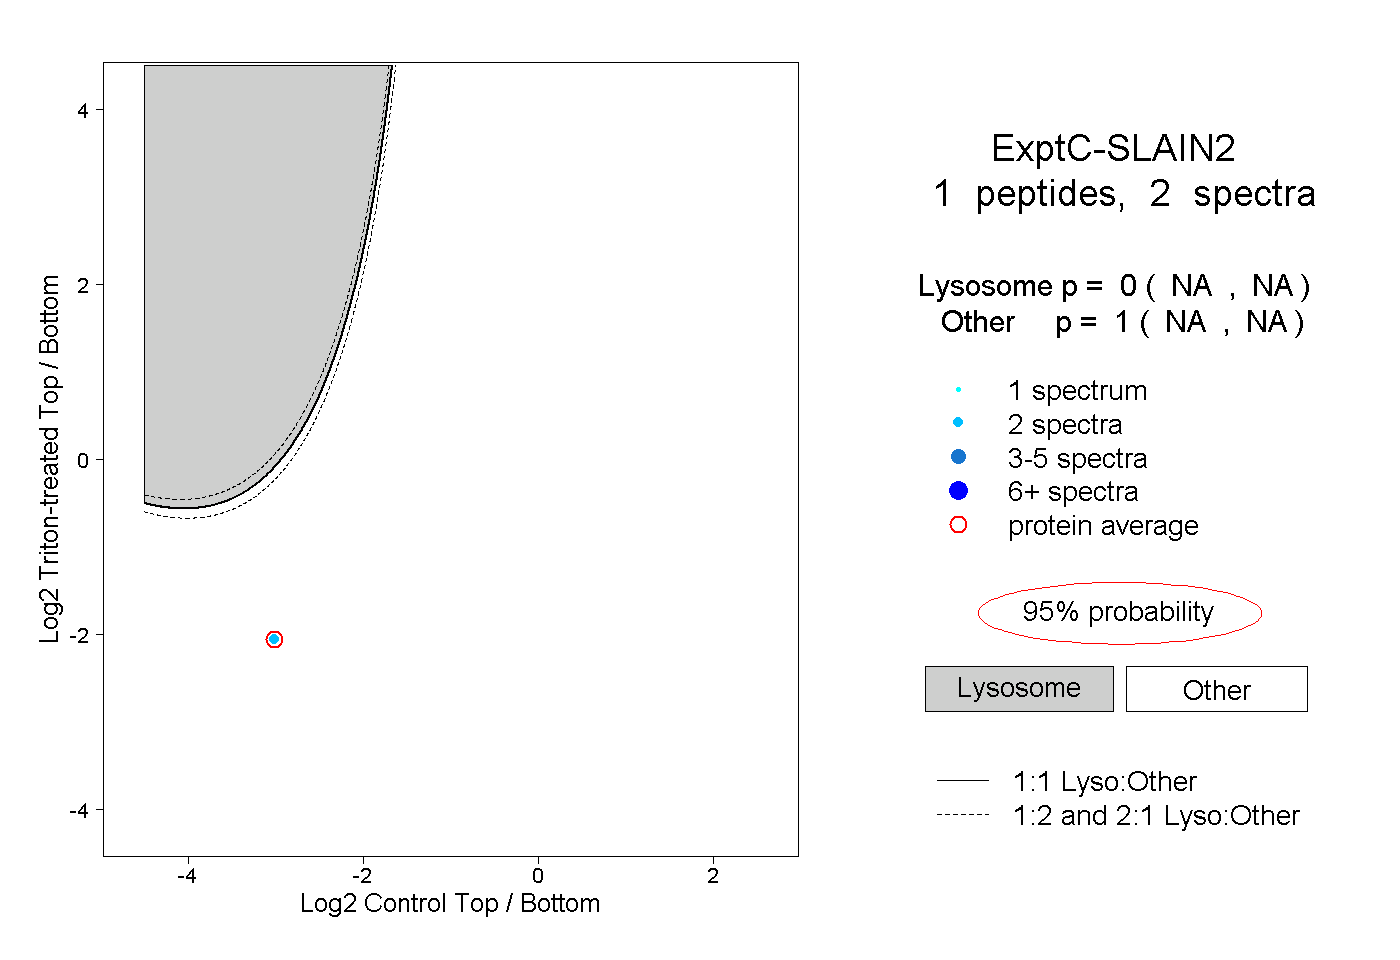 |
0.000 NA | NA |
1.000 NA | NA |