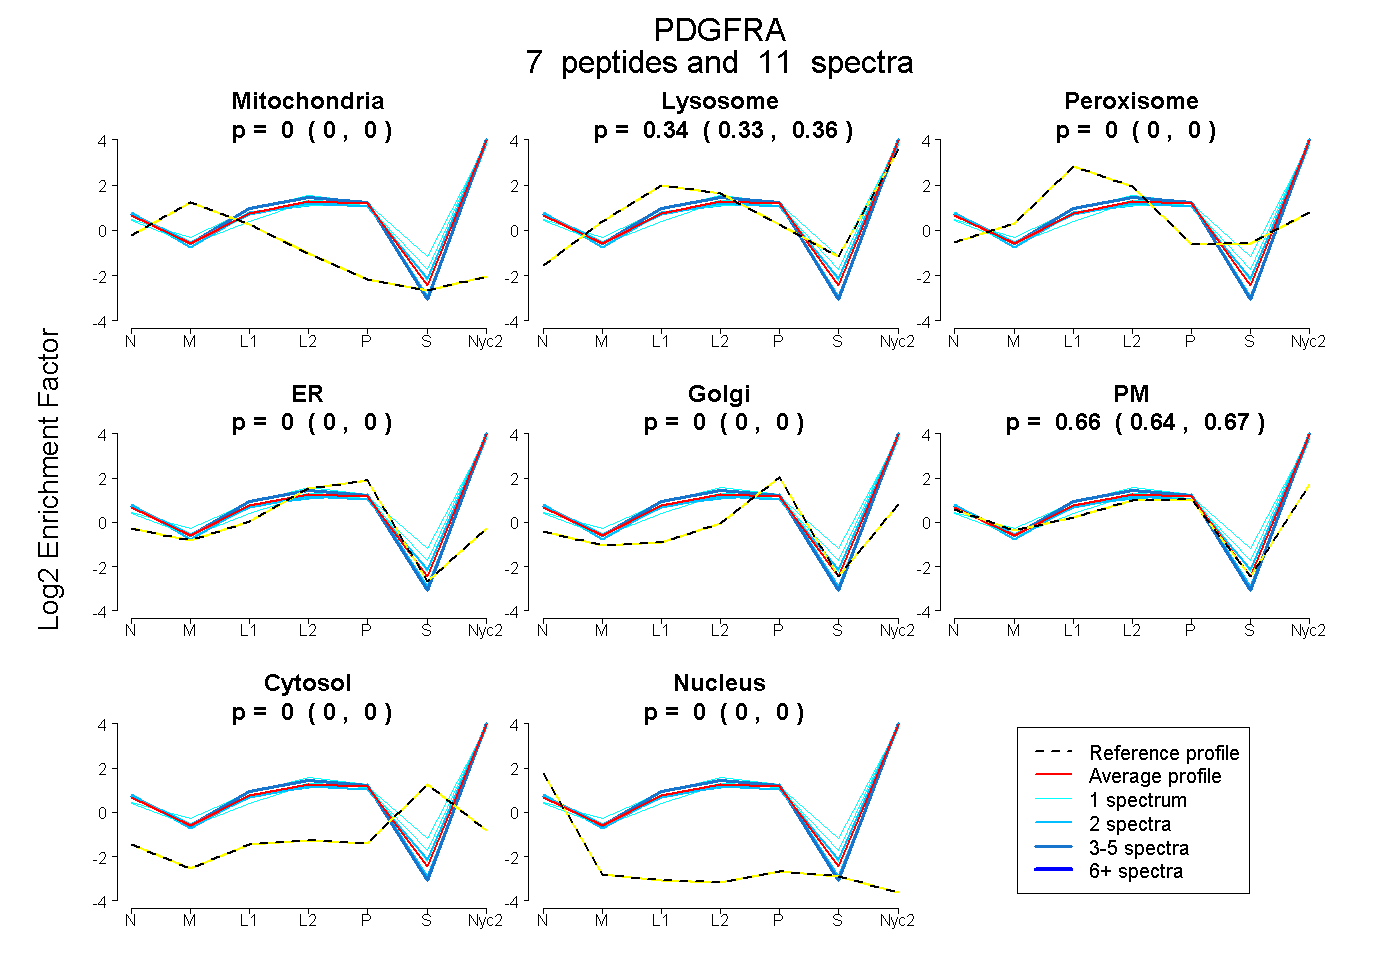
 7
7peptides
spectra
0.000 | 0.000
0.325 | 0.356
0.000 | 0.000
0.000 | 0.000
0.000 | 0.000
0.641 | 0.671
0.000 | 0.000
0.000 | 0.000
| Plot | Mito | Lyso | Perox | ER | Golgi | PM | Cytosol | Nucleus | |||||
| Expt A |
7 peptides |
11 spectra |
|
0.000 0.000 | 0.000 |
0.342 0.325 | 0.356 |
0.000 0.000 | 0.000 |
0.000 0.000 | 0.000 |
0.000 0.000 | 0.000 |
0.658 0.641 | 0.671 |
0.000 0.000 | 0.000 |
0.000 0.000 | 0.000 |
| 2 spectra, VVEGTAYGLSR | 0.000 | 0.361 | 0.000 | 0.000 | 0.000 | 0.639 | 0.000 | 0.000 | ||
| 1 spectrum, GITMLEEIK | 0.000 | 0.440 | 0.000 | 0.000 | 0.000 | 0.560 | 0.000 | 0.000 | ||
| 2 spectra, DSGDYECAAR | 0.000 | 0.247 | 0.000 | 0.000 | 0.000 | 0.753 | 0.000 | 0.000 | ||
| 3 spectra, MLKPTAR | 0.000 | 0.309 | 0.000 | 0.000 | 0.000 | 0.691 | 0.000 | 0.000 | ||
| 1 spectrum, DGLVLGR | 0.000 | 0.367 | 0.000 | 0.000 | 0.000 | 0.633 | 0.000 | 0.000 | ||
| 1 spectrum, IVPLSSSFSLR | 0.000 | 0.267 | 0.000 | 0.000 | 0.000 | 0.733 | 0.000 | 0.000 | ||
| 1 spectrum, SLYDRPASYK | 0.000 | 0.477 | 0.000 | 0.000 | 0.000 | 0.523 | 0.000 | 0.000 |
| Plot | Lyso | Other | |||||||||||
| Expt C |
10 peptides |
20 spectra |
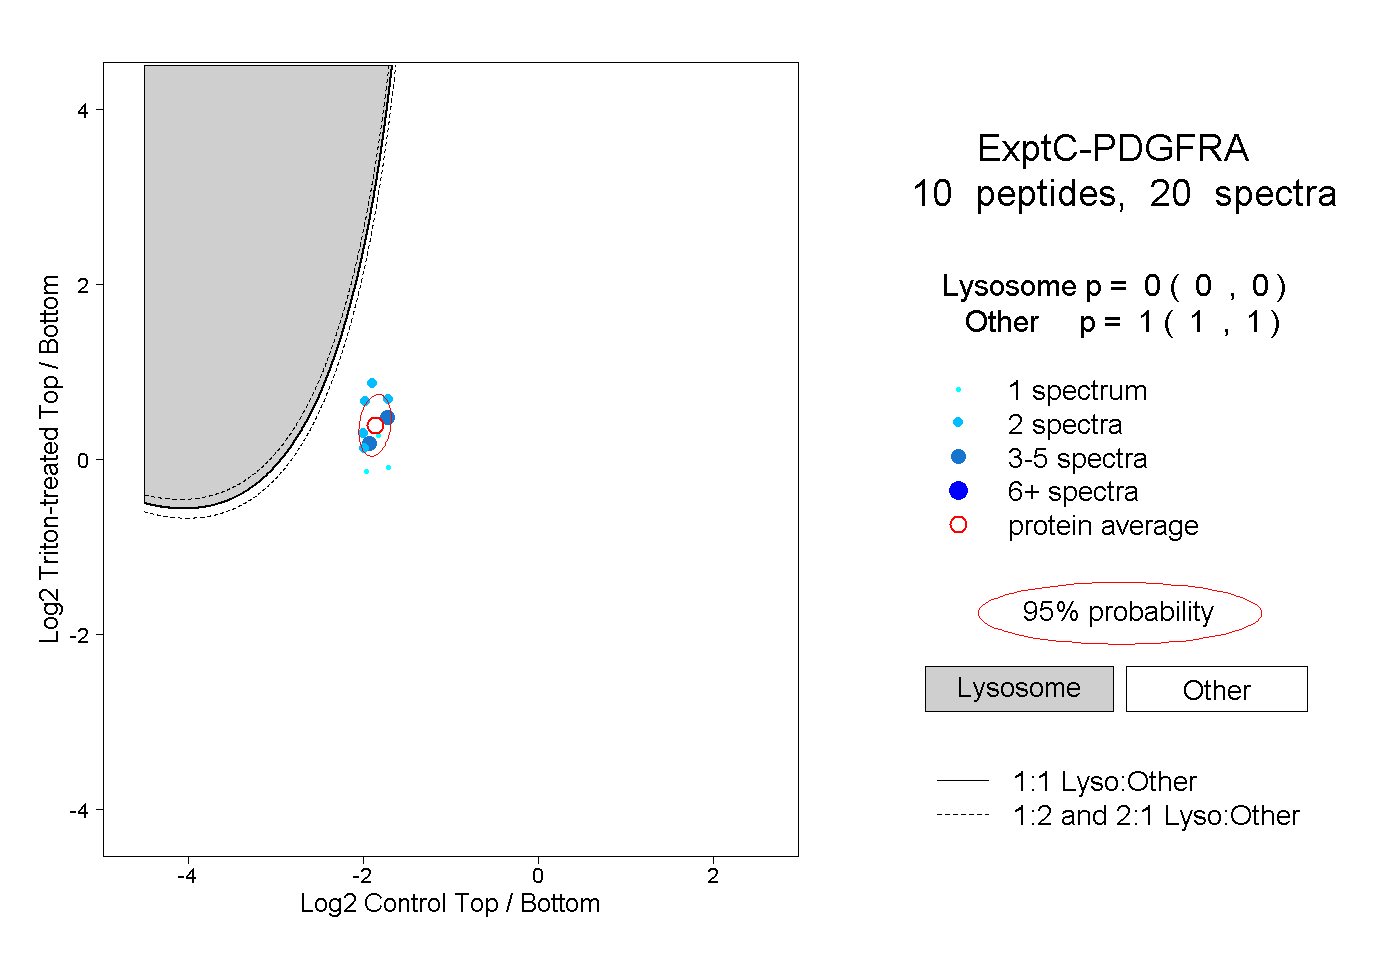 |
0.000 0.000 | 0.000 |
1.000 1.000 | 1.000 |
||||||||
| Plot | Lyso | Other | |||||||||||
| Expt D |
1 peptide |
2 spectra |
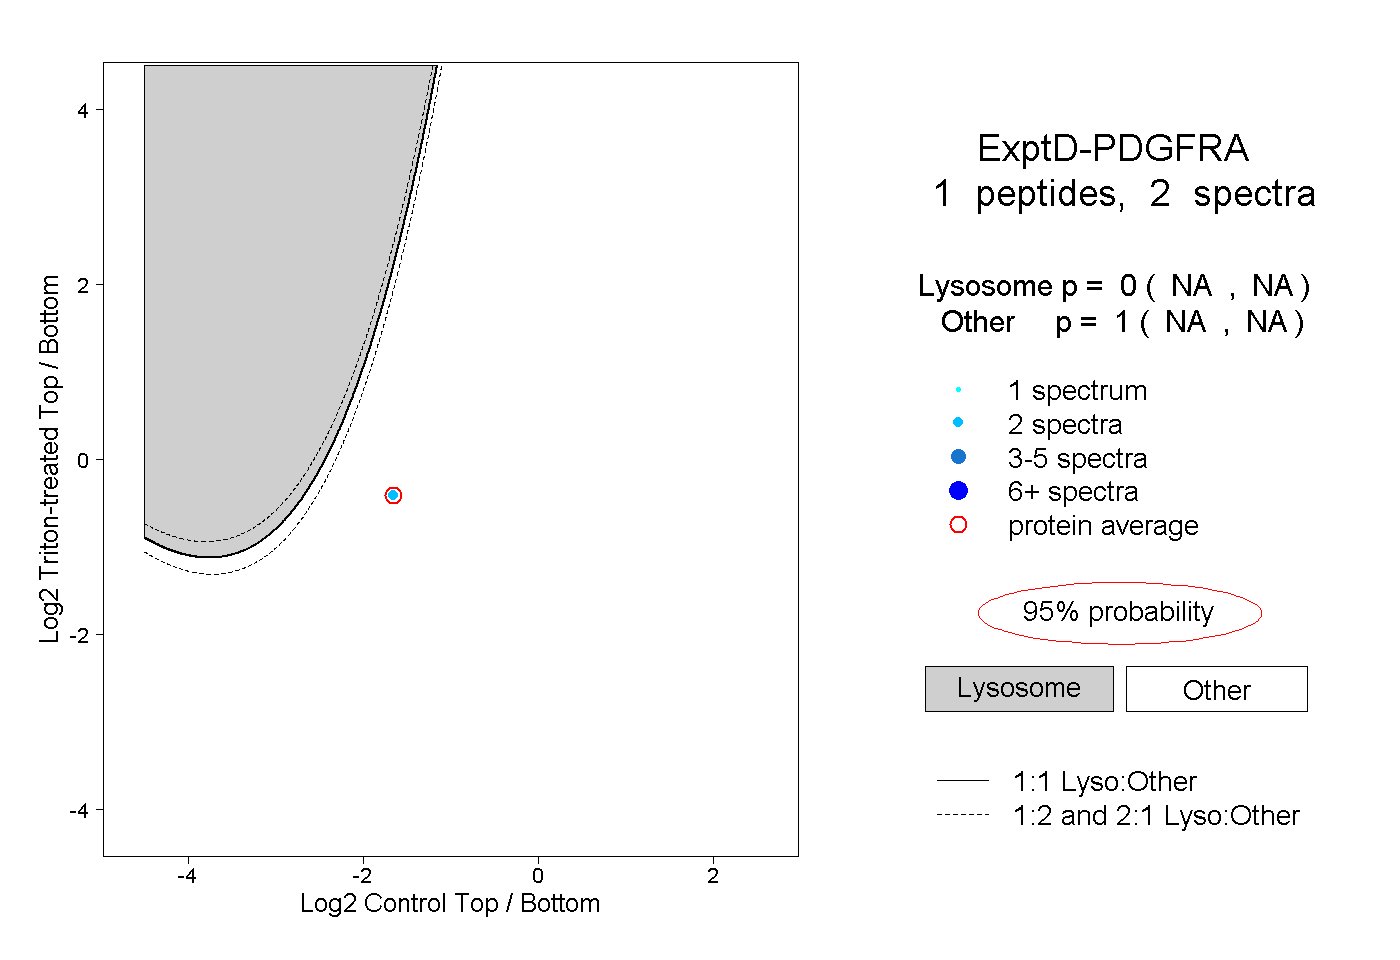 |
0.000 NA | NA |
1.000 NA | NA |