 3
3peptides
spectra
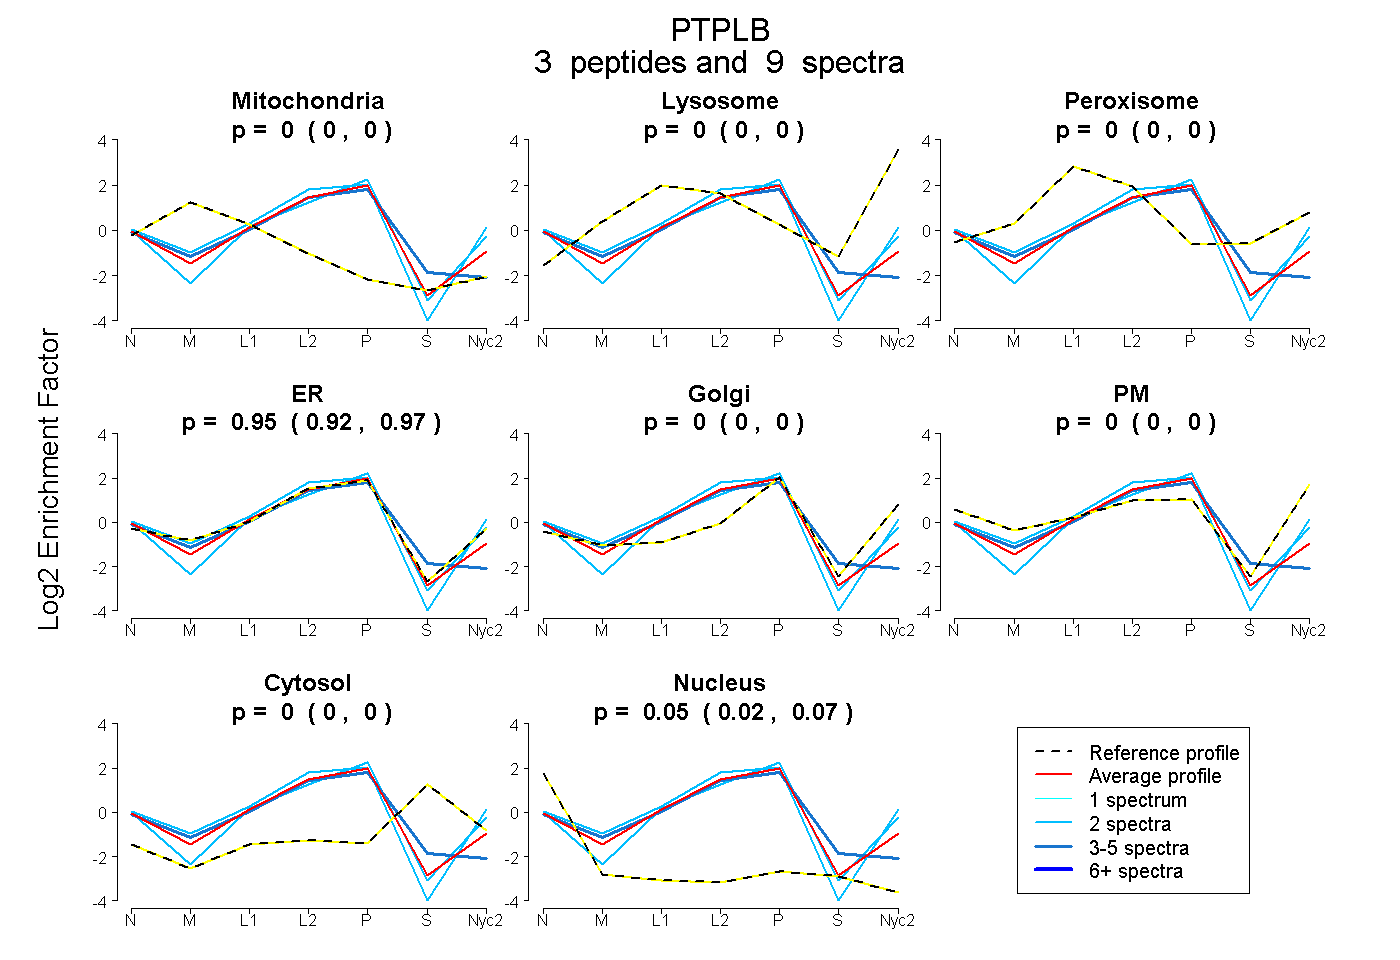
0.000 | 0.000
0.000 | 0.000
0.000 | 0.000
0.921 | 0.966
0.000 | 0.000
0.000 | 0.000
0.000 | 0.000
0.025 | 0.073
4peptides
spectra
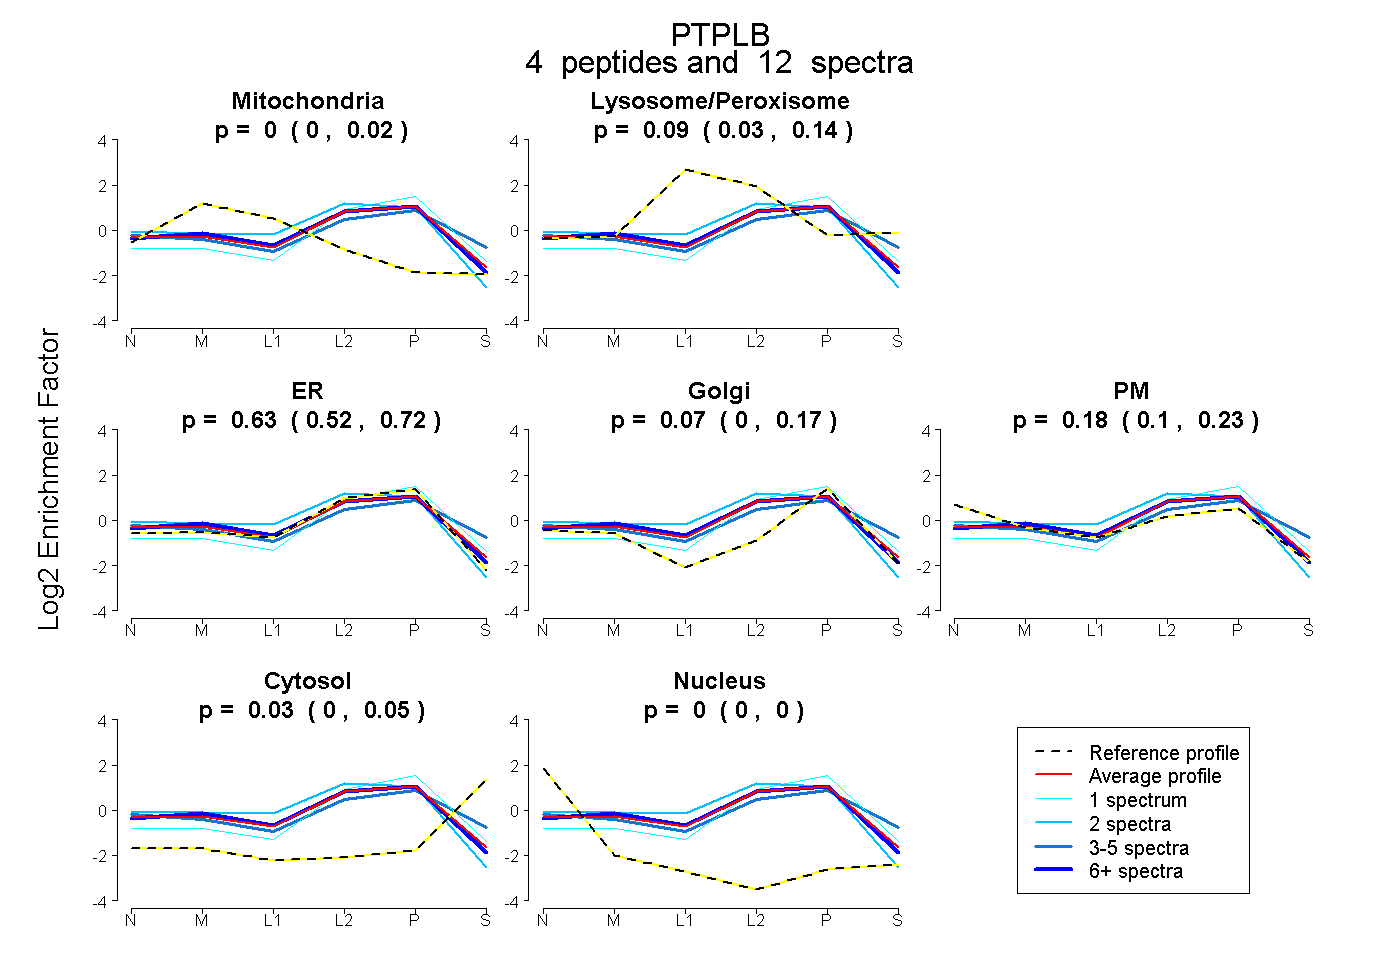
0.000 | 0.022
0.031 | 0.137
0.517 | 0.718
0.000 | 0.166
0.103 | 0.233
0.000 | 0.053
0.000 | 0.000
2peptides
spectra
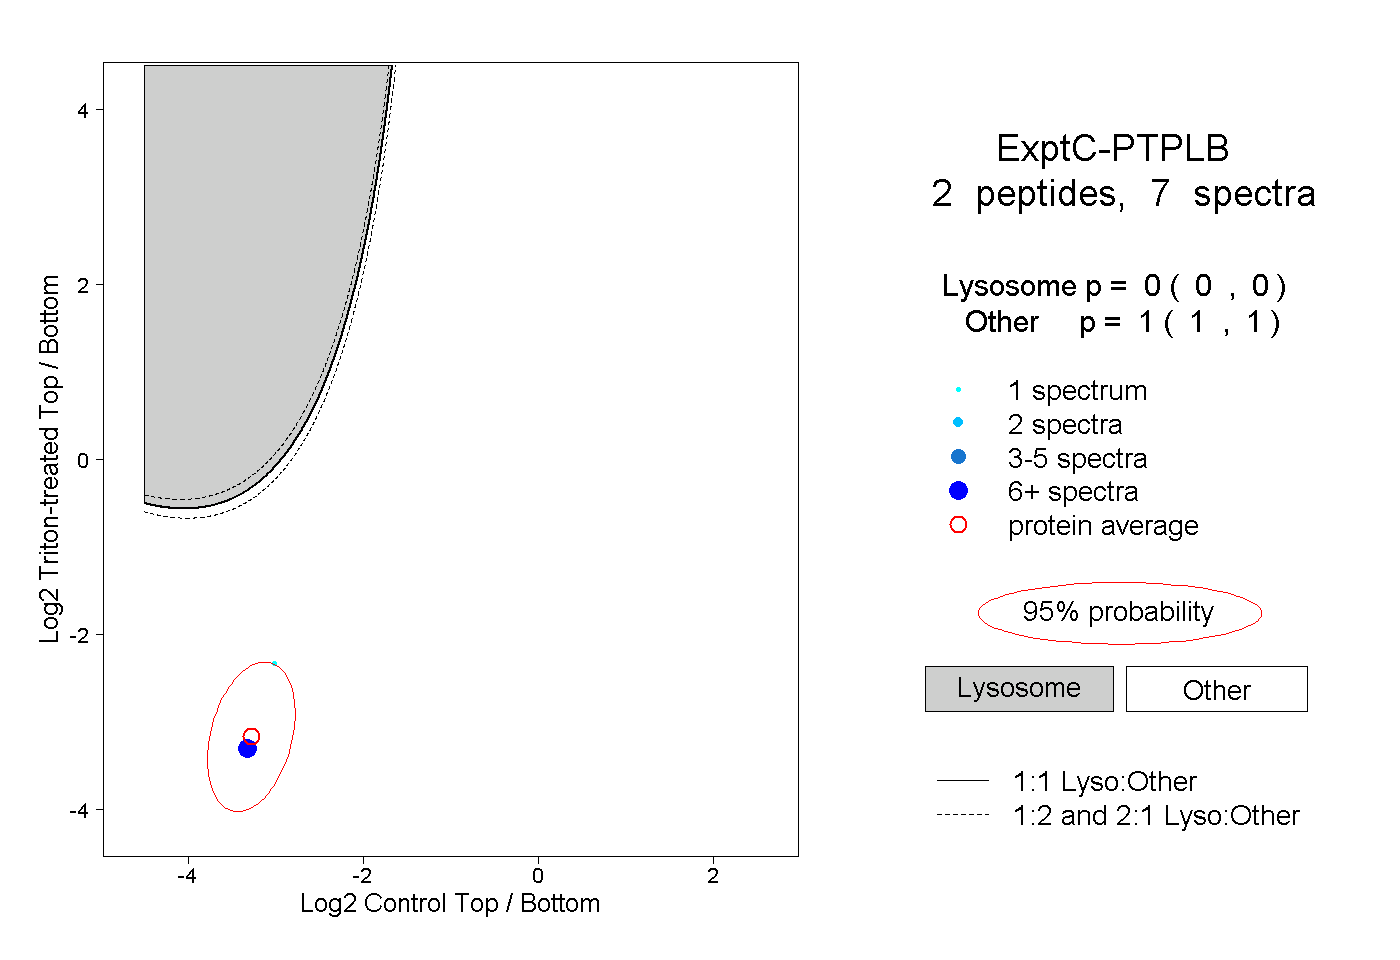
0.000 | 0.000
1.000 | 1.000