 3
3peptides
spectra
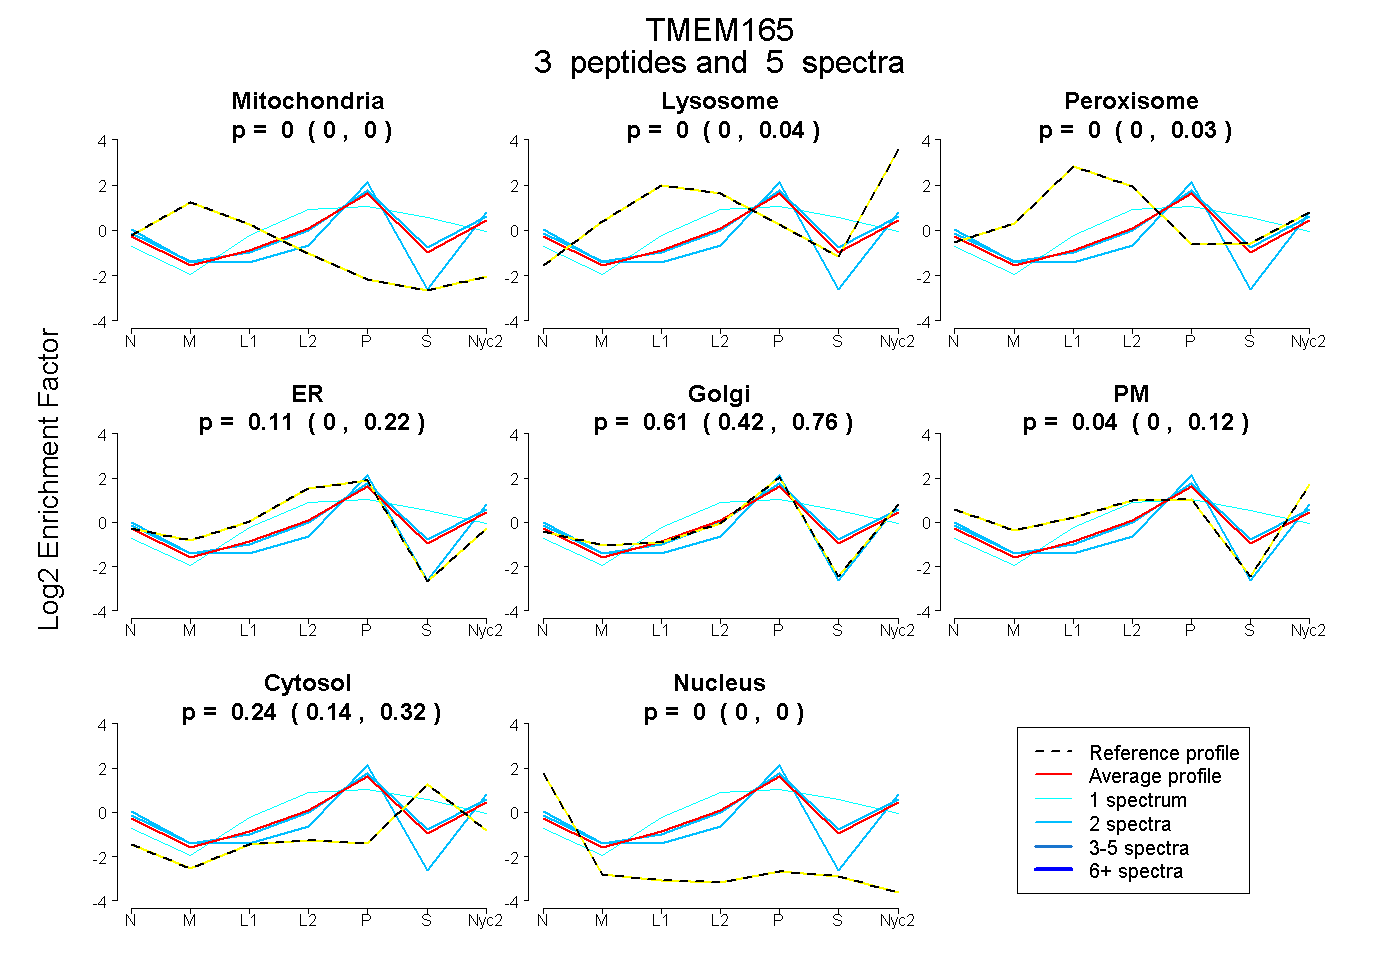
0.000 | 0.000
0.000 | 0.042
0.000 | 0.034
0.000 | 0.223
0.415 | 0.757
0.000 | 0.121
0.139 | 0.320
0.000 | 0.000
1peptide
spectra
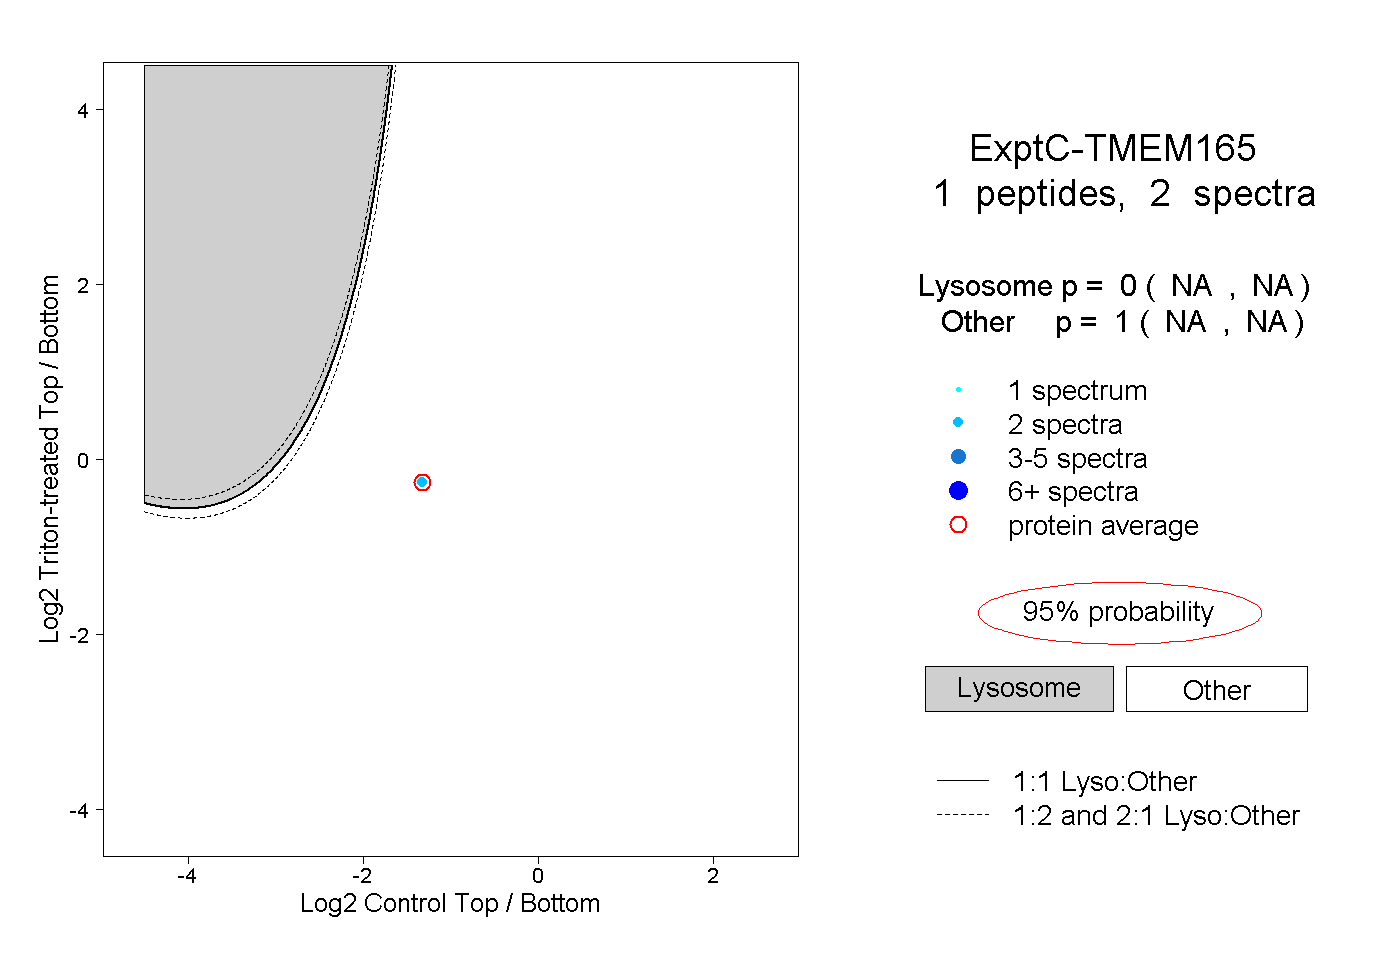
NA | NA
NA | NA
| Plot | Mito | Lyso | Perox | ER | Golgi | PM | Cytosol | Nucleus | |||||
| Expt A |
3 peptides |
5 spectra |
|
0.000 0.000 | 0.000 |
0.000 0.000 | 0.042 |
0.000 0.000 | 0.034 |
0.108 0.000 | 0.223 |
0.609 0.415 | 0.757 |
0.039 0.000 | 0.121 |
0.244 0.139 | 0.320 |
0.000 0.000 | 0.000 |
||
| Plot | Lyso | Other | |||||||||||
| Expt C |
1 peptide |
2 spectra |
|
0.000 NA | NA |
1.000 NA | NA |