13
13peptides
spectra
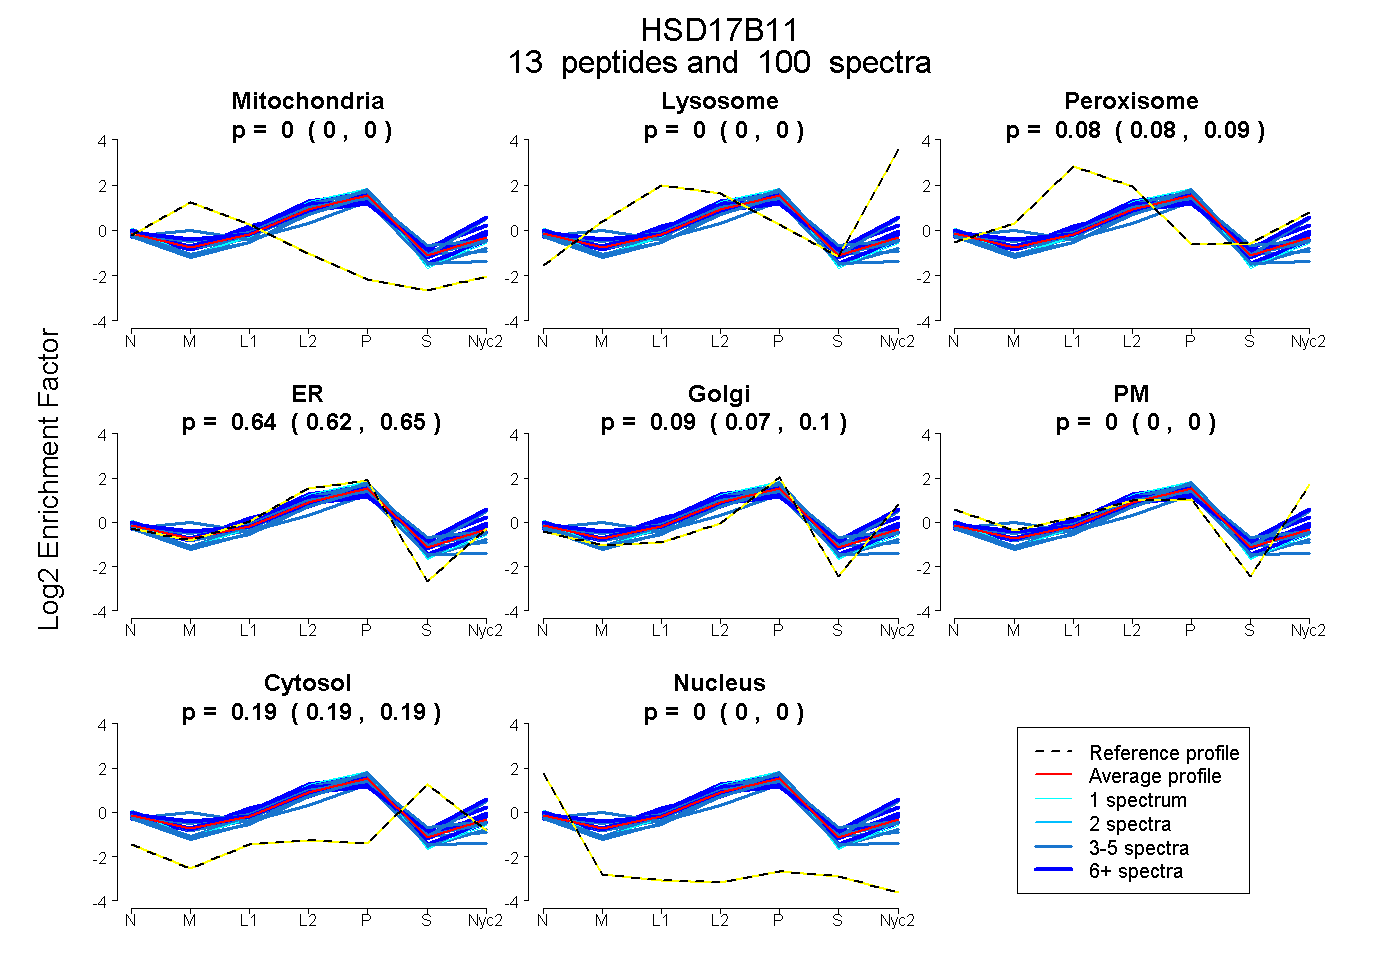
0.000 | 0.000
0.000 | 0.000
0.077 | 0.087
0.621 | 0.652
0.074 | 0.102
0.000 | 0.000
0.186 | 0.194
0.000 | 0.000
7peptides
spectra
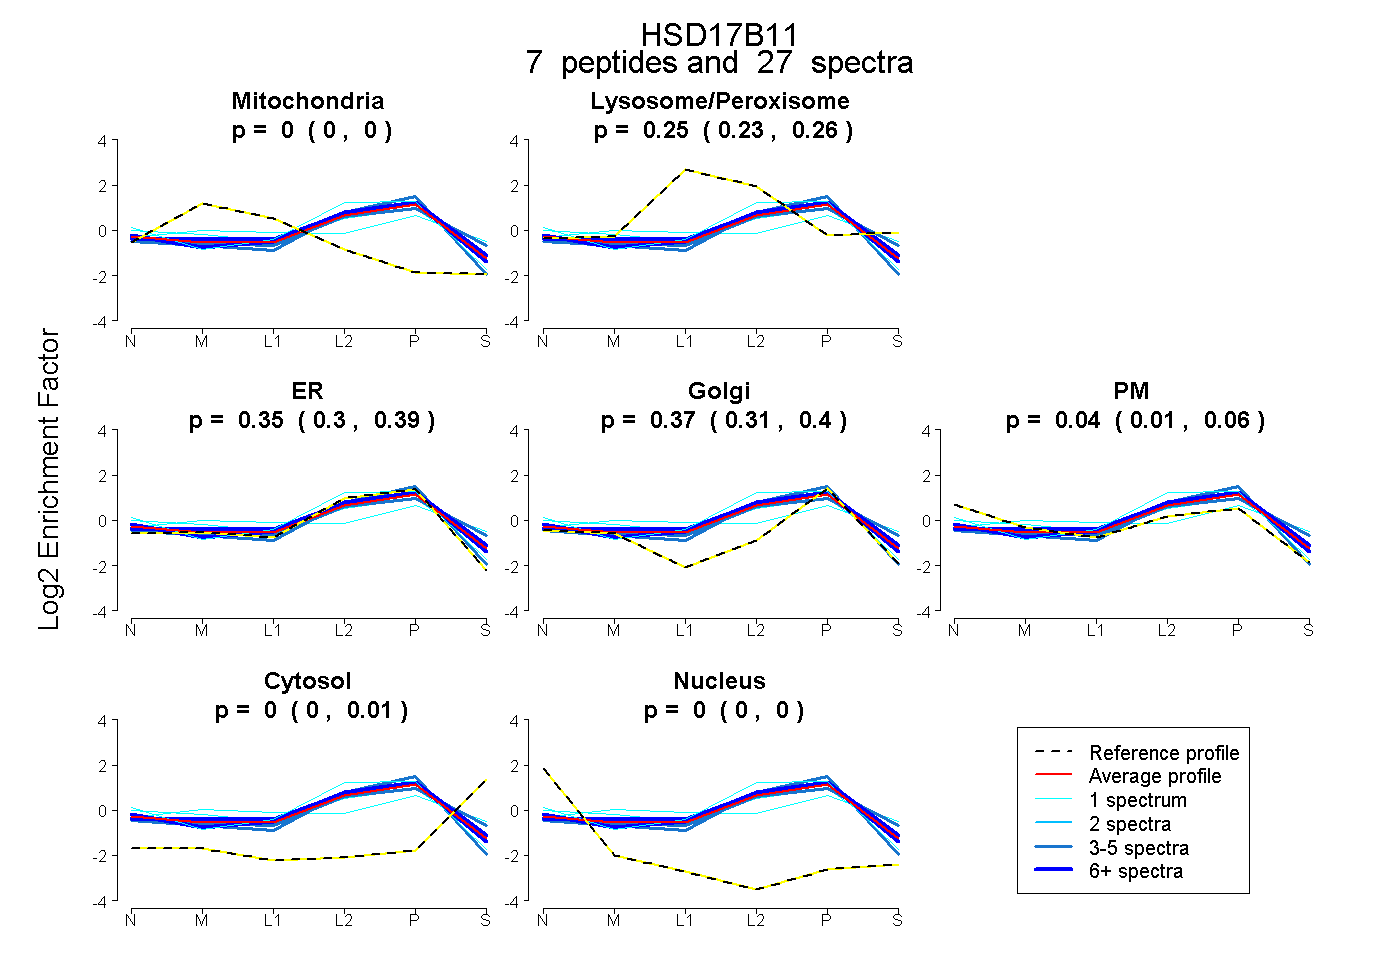
0.000 | 0.000
0.225 | 0.264
0.304 | 0.386
0.315 | 0.403
0.009 | 0.060
0.000 | 0.015
0.000 | 0.000