 2
2peptides
spectra
0.000 | 0.000
0.000 | 0.000
0.000 | 0.000
0.000 | 0.068
0.000 | 0.043
0.736 | 0.872
0.000 | 0.226
0.000 | 0.079
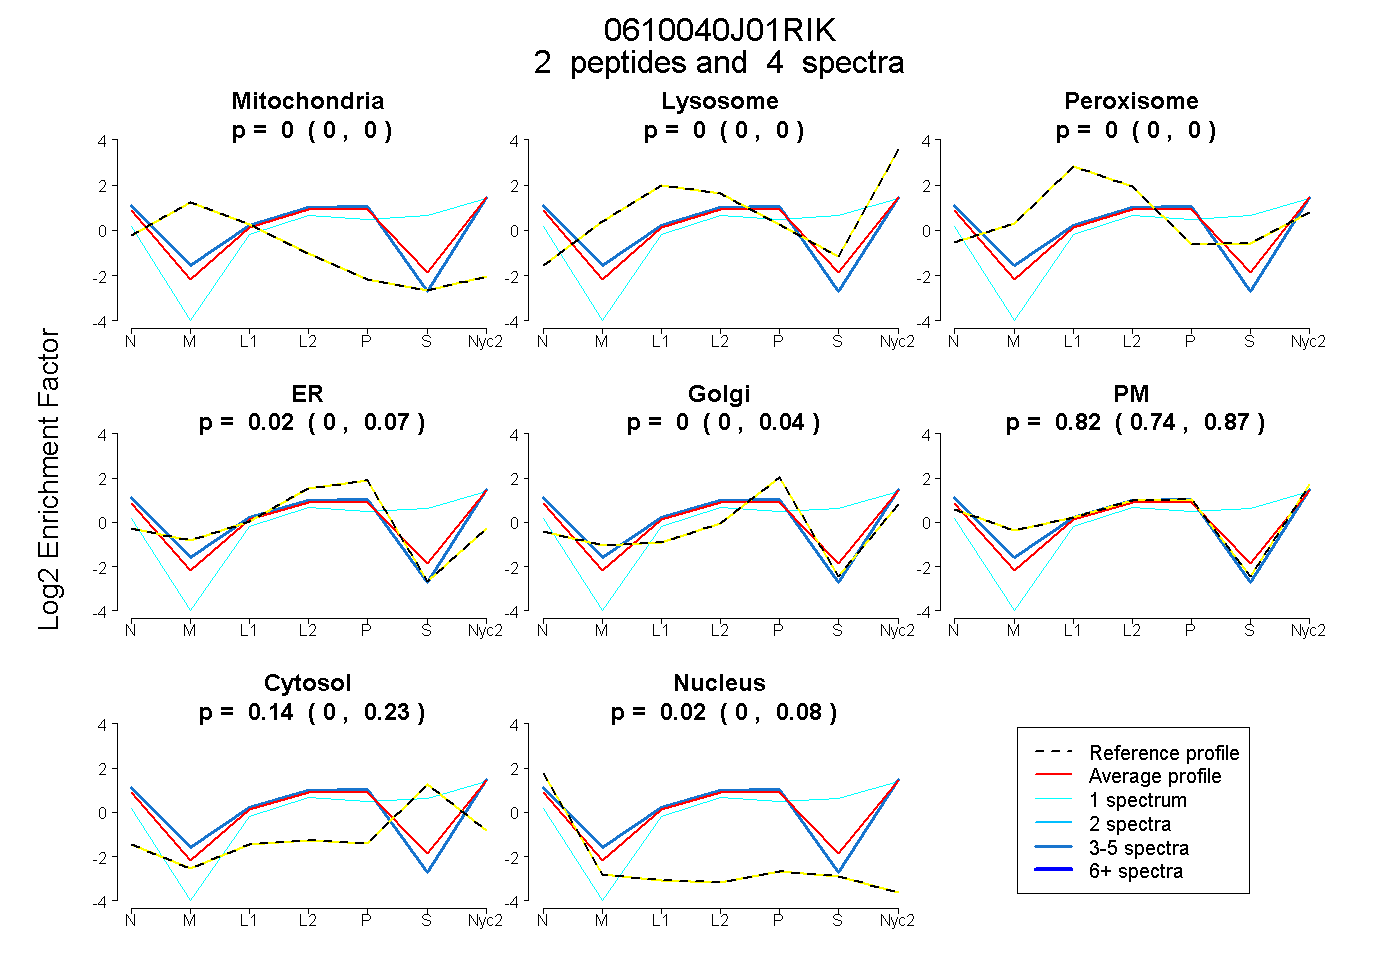
| Plot | Mito | Lyso | Perox | ER | Golgi | PM | Cytosol | Nucleus | |||||
| Expt A |
2 peptides |
4 spectra |
|
0.000 0.000 | 0.000 |
0.000 0.000 | 0.000 |
0.000 0.000 | 0.000 |
0.019 0.000 | 0.068 |
0.000 0.000 | 0.043 |
0.824 0.736 | 0.872 |
0.139 0.000 | 0.226 |
0.018 0.000 | 0.079 |
| 1 spectrum, HGIVNGIRPTATLQSVR | 0.000 | 0.067 | 0.000 | 0.000 | 0.000 | 0.378 | 0.555 | 0.000 | ||
| 3 spectra, LEEDDTVR | 0.000 | 0.000 | 0.000 | 0.038 | 0.000 | 0.903 | 0.000 | 0.059 |
| Plot | Mito | Lyso or Perox | ER | Golgi | PM | Cytosol | Nucleus | ||||||
| Expt B |
1 peptide |
2 spectra |
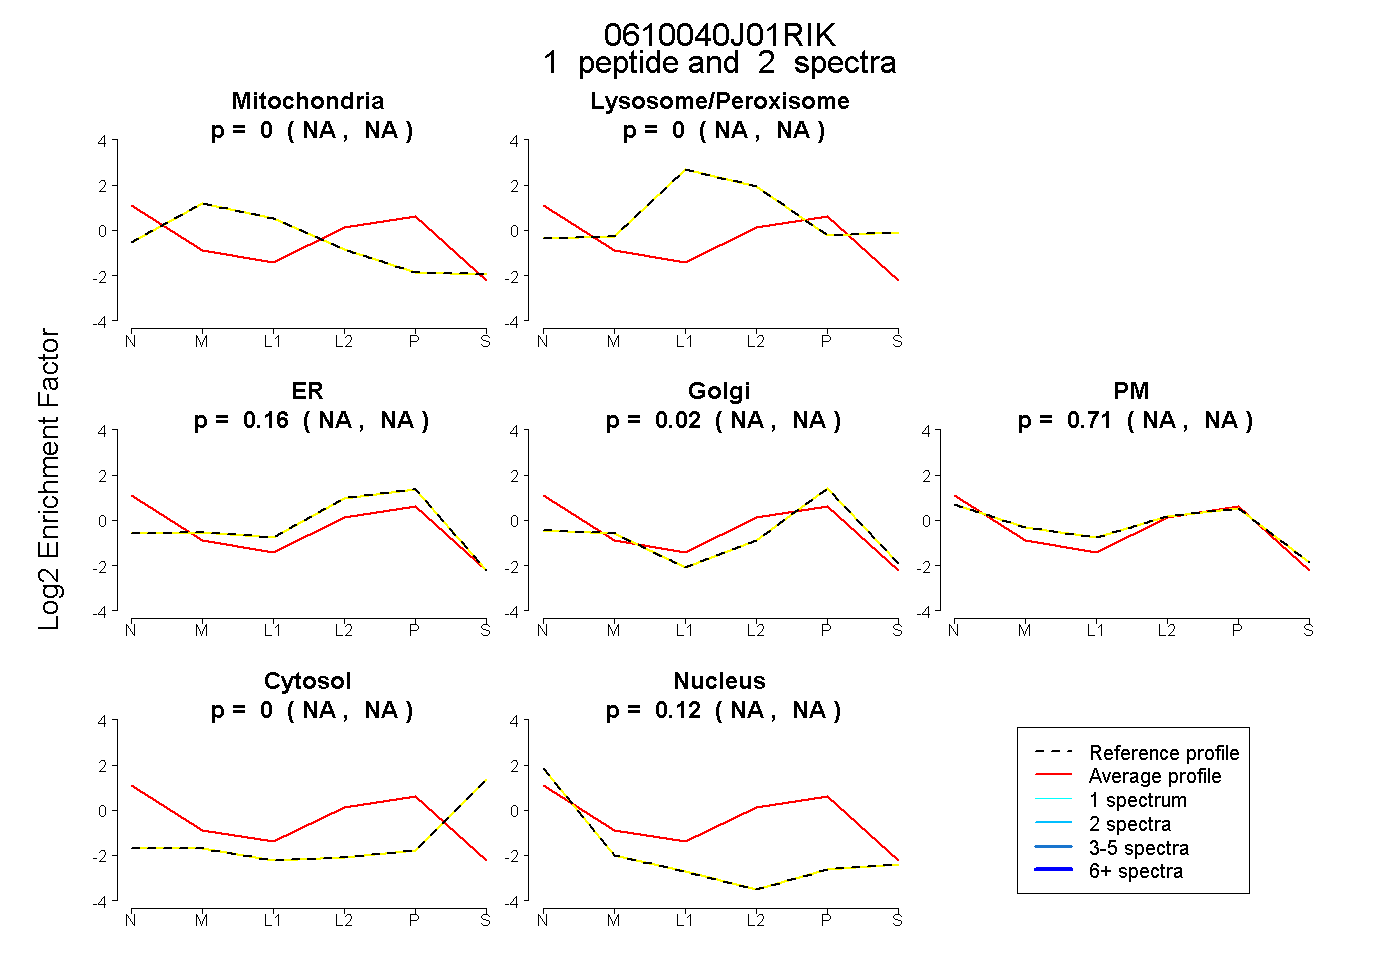 |
0.000 NA | NA |
0.000 NA | NA |
0.160 NA | NA |
0.019 NA | NA |
0.706 NA | NA |
0.000 NA | NA |
0.115 NA | NA |