 4
4peptides
spectra
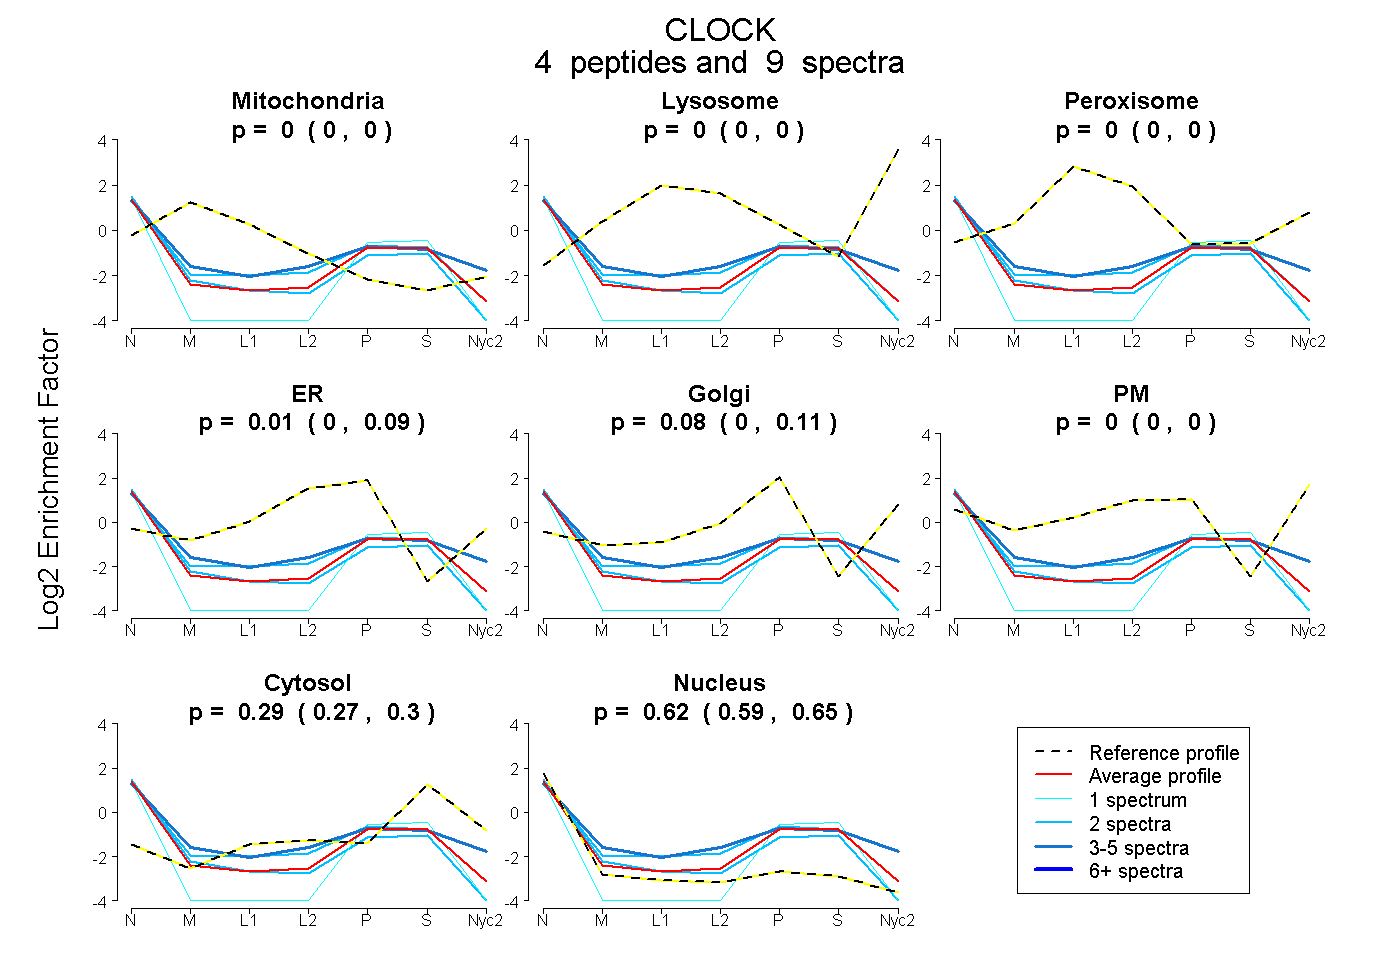
0.000 | 0.000
0.000 | 0.000
0.000 | 0.000
0.000 | 0.095
0.000 | 0.113
0.000 | 0.000
0.268 | 0.304
0.587 | 0.655
| Plot | Mito | Lyso | Perox | ER | Golgi | PM | Cytosol | Nucleus | |||||
| Expt A |
4 peptides |
9 spectra |
|
0.000 0.000 | 0.000 |
0.000 0.000 | 0.000 |
0.000 0.000 | 0.000 |
0.006 0.000 | 0.095 |
0.082 0.000 | 0.113 |
0.000 0.000 | 0.000 |
0.288 0.268 | 0.304 |
0.624 0.587 | 0.655 |
| 2 spectra, EITAQSDASEIR | 0.000 | 0.000 | 0.000 | 0.037 | 0.000 | 0.000 | 0.224 | 0.739 | ||
| 2 spectra, EPSTYEYVR | 0.000 | 0.000 | 0.000 | 0.185 | 0.000 | 0.000 | 0.269 | 0.546 | ||
| 4 spectra, FLFLDHR | 0.000 | 0.000 | 0.000 | 0.011 | 0.022 | 0.231 | 0.289 | 0.447 | ||
| 1 spectrum, ELGIEESLPETAADK | 0.000 | 0.000 | 0.000 | 0.000 | 0.000 | 0.000 | 0.222 | 0.778 |