 6
6peptides
spectra
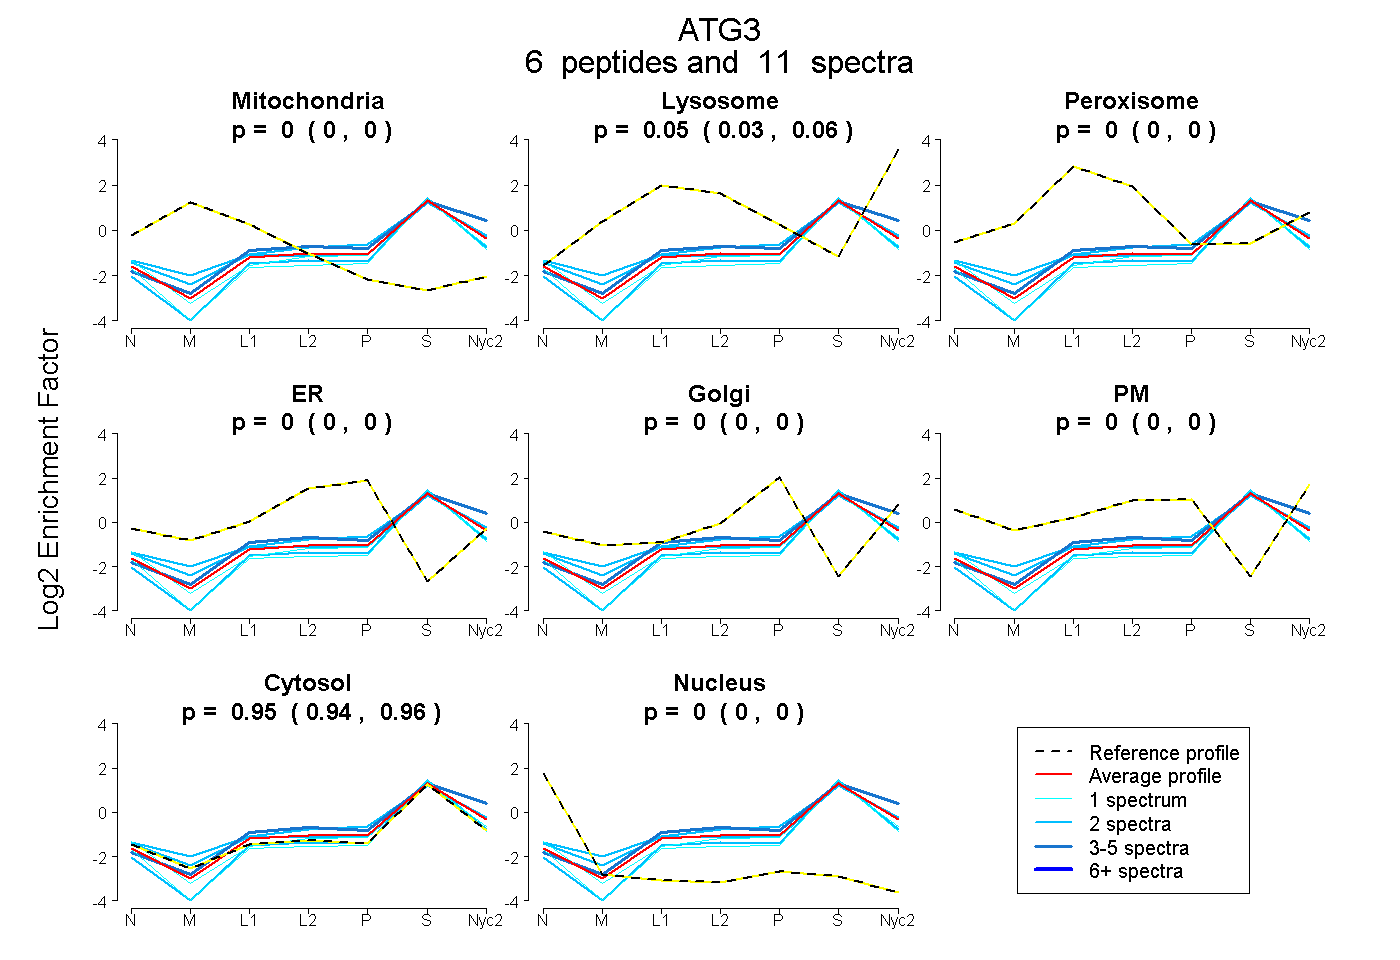
0.000 | 0.000
0.033 | 0.062
0.000 | 0.000
0.000 | 0.000
0.000 | 0.000
0.000 | 0.000
0.935 | 0.965
0.000 | 0.000
3peptides
spectra
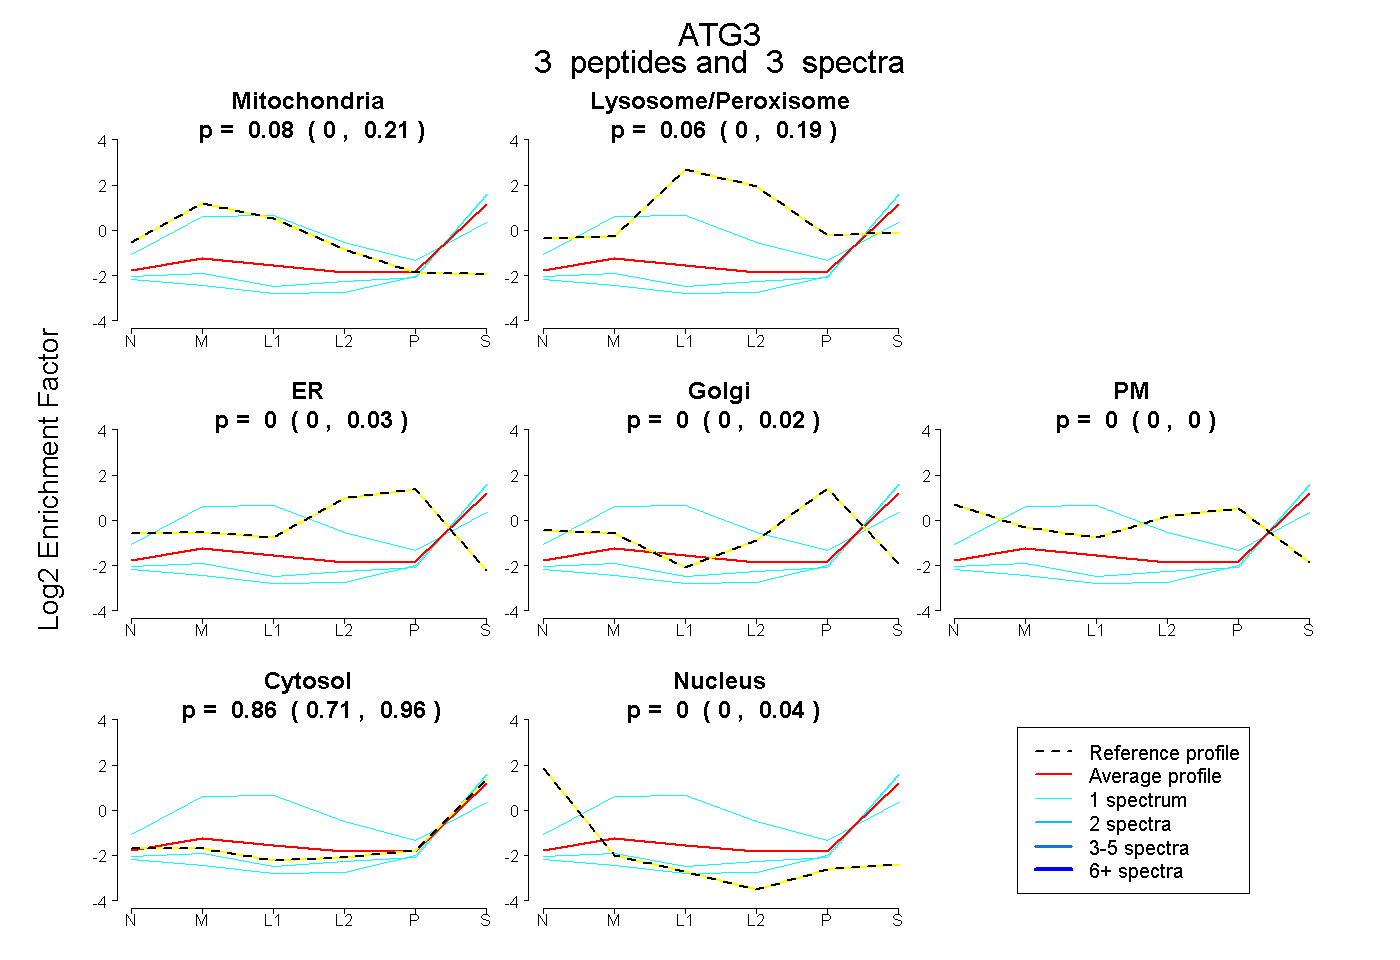
0.000 | 0.213
0.000 | 0.187
0.000 | 0.025
0.000 | 0.018
0.000 | 0.000
0.706 | 0.965
0.000 | 0.039
7peptides
spectra
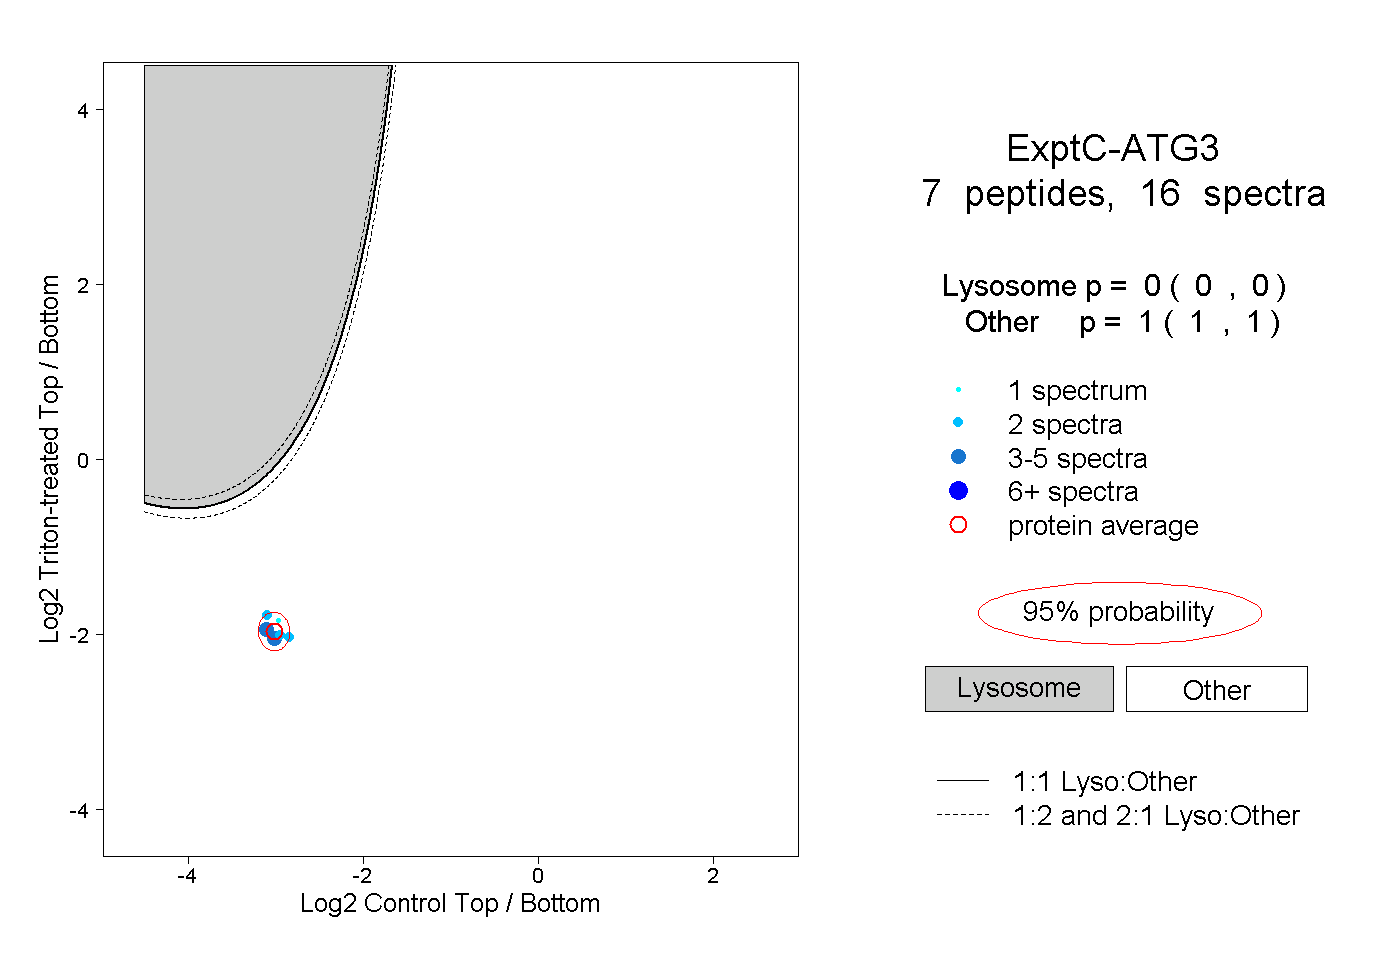
0.000 | 0.000
1.000 | 1.000