23
23peptides
spectra
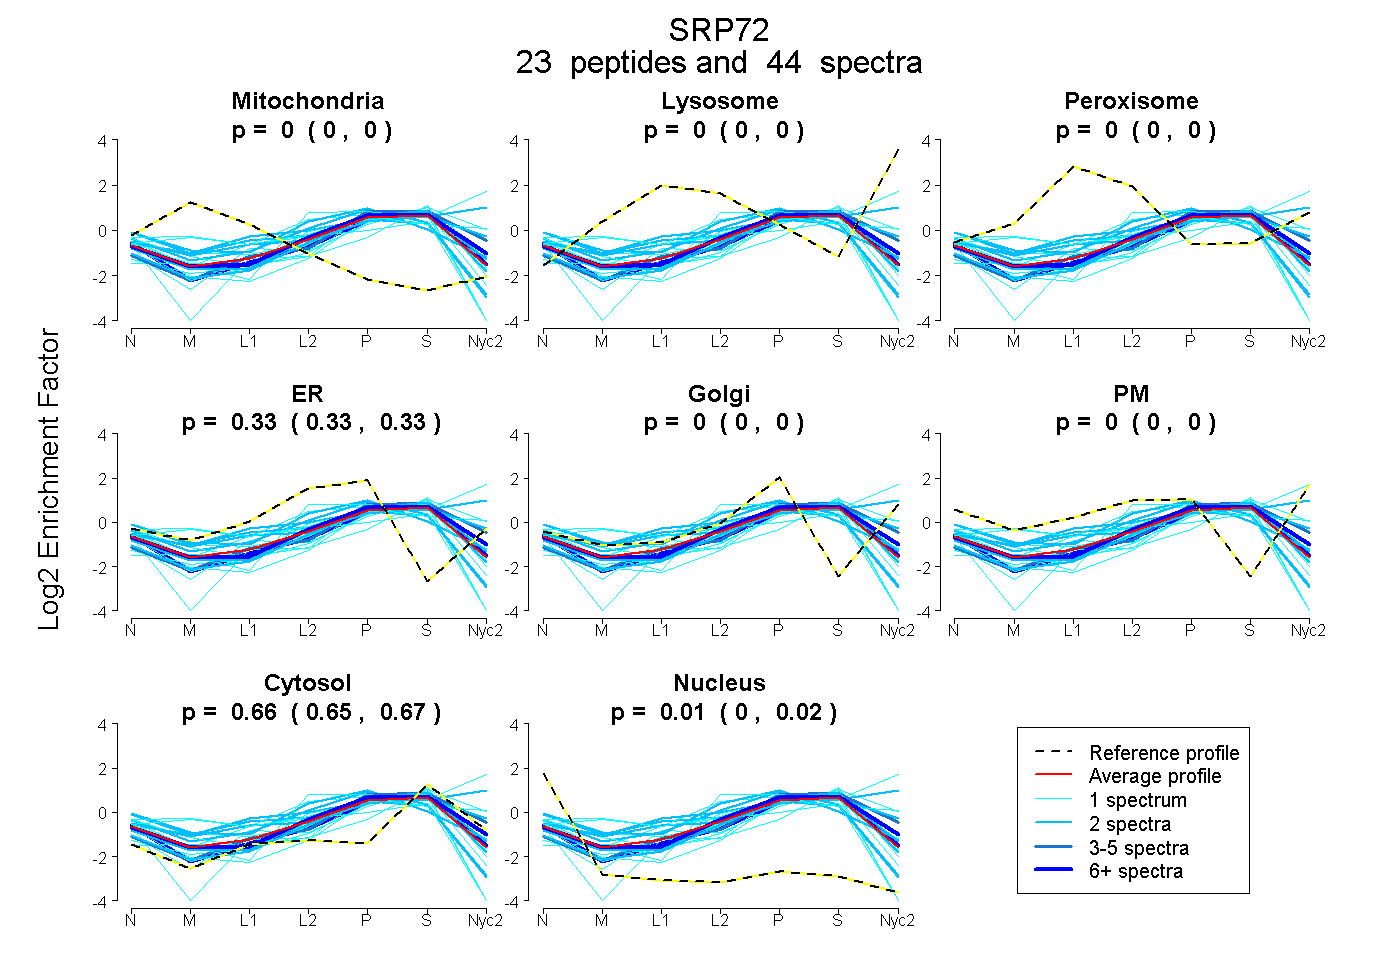
0.000 | 0.000
0.000 | 0.000
0.000 | 0.000
0.326 | 0.334
0.000 | 0.000
0.000 | 0.000
0.655 | 0.666
0.002 | 0.015
9peptides
spectra

0.000 | 0.000
0.152 | 0.197
0.577 | 0.646
0.000 | 0.034
0.000 | 0.000
0.179 | 0.205
0.000 | 0.000