 23
23peptides
spectra
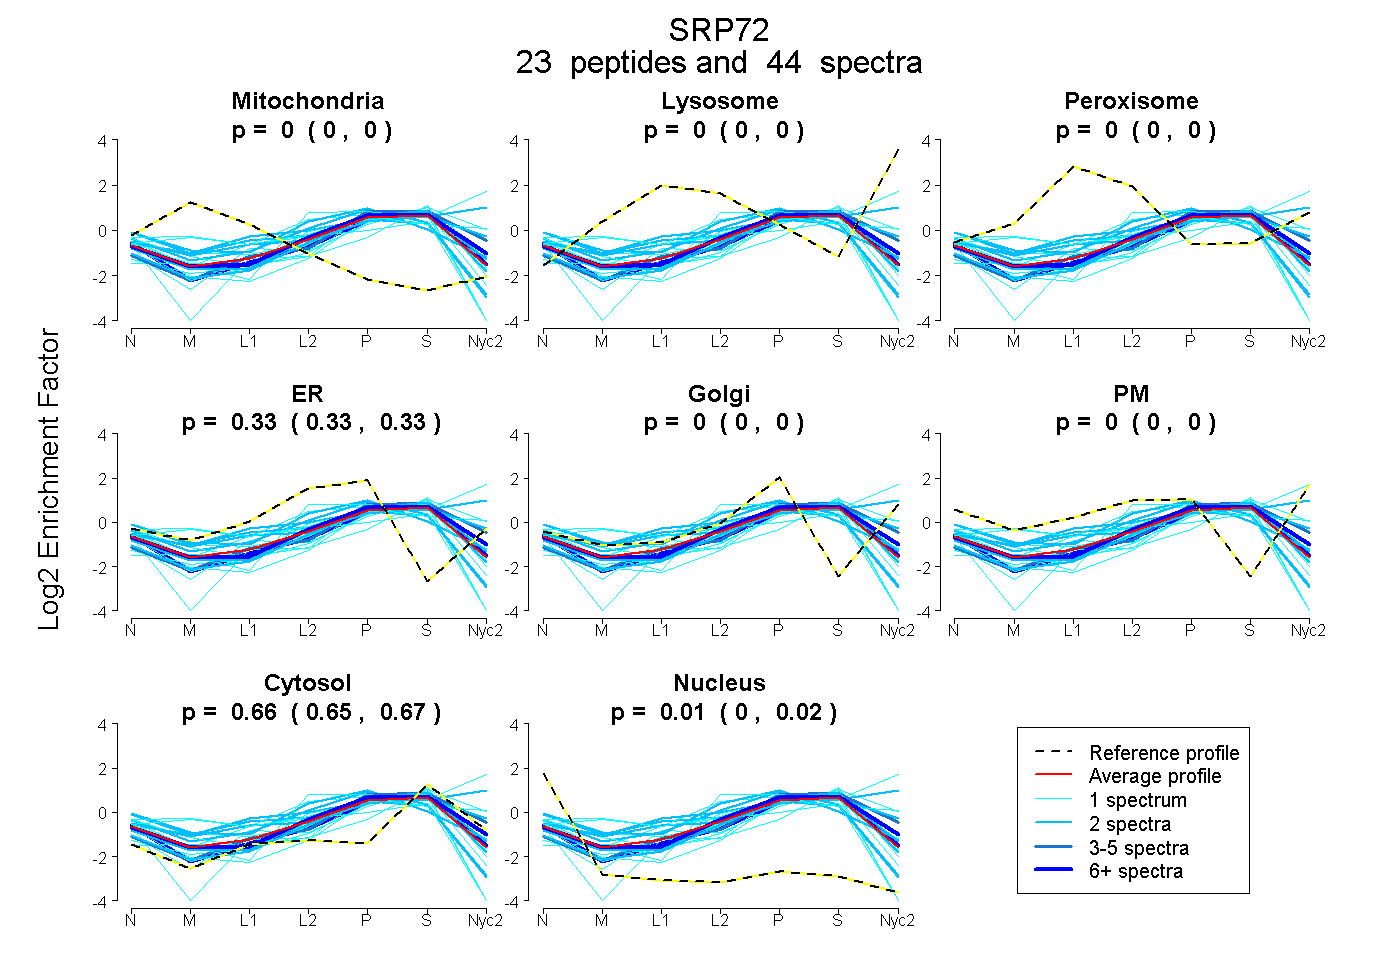
0.000 | 0.000
0.000 | 0.000
0.000 | 0.000
0.326 | 0.334
0.000 | 0.000
0.000 | 0.000
0.655 | 0.666
0.002 | 0.015
| Plot | Mito | Lyso | Perox | ER | Golgi | PM | Cytosol | Nucleus | |||||
| Expt A |
23 peptides |
44 spectra |
|
0.000 0.000 | 0.000 |
0.000 0.000 | 0.000 |
0.000 0.000 | 0.000 |
0.330 0.326 | 0.334 |
0.000 0.000 | 0.000 |
0.000 0.000 | 0.000 |
0.661 0.655 | 0.666 |
0.009 0.002 | 0.015 |
| 3 spectra, LTMAQLK | 0.000 | 0.000 | 0.000 | 0.003 | 0.339 | 0.000 | 0.658 | 0.000 | ||
| 1 spectrum, SPAHLSLIR | 0.345 | 0.000 | 0.000 | 0.172 | 0.000 | 0.000 | 0.424 | 0.059 | ||
| 1 spectrum, LTNAEGVEFK | 0.000 | 0.000 | 0.000 | 0.250 | 0.000 | 0.000 | 0.665 | 0.085 | ||
| 2 spectra, IEEALQLYNQIIK | 0.000 | 0.000 | 0.000 | 0.427 | 0.000 | 0.000 | 0.487 | 0.086 | ||
| 7 spectra, AYCEYR | 0.000 | 0.000 | 0.000 | 0.251 | 0.000 | 0.000 | 0.718 | 0.030 | ||
| 2 spectra, VDVEALENSPGATYIR | 0.000 | 0.000 | 0.170 | 0.000 | 0.303 | 0.000 | 0.528 | 0.000 | ||
| 2 spectra, EAANFK | 0.139 | 0.000 | 0.000 | 0.334 | 0.000 | 0.000 | 0.457 | 0.070 | ||
| 1 spectrum, EALNVINTHTK | 0.083 | 0.000 | 0.000 | 0.089 | 0.000 | 0.000 | 0.828 | 0.000 | ||
| 1 spectrum, GTQGATAGASSELDASK | 0.000 | 0.000 | 0.000 | 0.120 | 0.000 | 0.000 | 0.663 | 0.217 | ||
| 1 spectrum, AEDLCR | 0.000 | 0.000 | 0.000 | 0.250 | 0.000 | 0.000 | 0.558 | 0.191 | ||
| 1 spectrum, QLQAIEFNK | 0.000 | 0.000 | 0.000 | 0.378 | 0.000 | 0.000 | 0.611 | 0.011 | ||
| 2 spectra, TIESANQQTDK | 0.000 | 0.000 | 0.000 | 0.249 | 0.000 | 0.000 | 0.738 | 0.014 | ||
| 1 spectrum, NSQDDYDEER | 0.000 | 0.000 | 0.000 | 0.415 | 0.000 | 0.000 | 0.585 | 0.000 | ||
| 1 spectrum, ACLILR | 0.000 | 0.000 | 0.000 | 0.125 | 0.000 | 0.000 | 0.625 | 0.251 | ||
| 2 spectra, ISQGNISK | 0.000 | 0.255 | 0.000 | 0.000 | 0.091 | 0.177 | 0.477 | 0.000 | ||
| 1 spectrum, DIHTLAQLISAYSLVDPEK | 0.000 | 0.057 | 0.000 | 0.000 | 0.221 | 0.000 | 0.721 | 0.000 | ||
| 2 spectra, VLANNSLSFEK | 0.000 | 0.000 | 0.000 | 0.288 | 0.024 | 0.000 | 0.687 | 0.000 | ||
| 1 spectrum, HLPSSDSMSLK | 0.000 | 0.272 | 0.000 | 0.000 | 0.128 | 0.171 | 0.429 | 0.000 | ||
| 1 spectrum, DDVTALHCK | 0.000 | 0.000 | 0.000 | 0.045 | 0.188 | 0.000 | 0.766 | 0.000 | ||
| 1 spectrum, VVCLIQNGSFK | 0.000 | 0.000 | 0.224 | 0.000 | 0.384 | 0.000 | 0.392 | 0.000 | ||
| 7 spectra, YGQNSDFTR | 0.000 | 0.000 | 0.000 | 0.265 | 0.086 | 0.000 | 0.648 | 0.000 | ||
| 2 spectra, IENALK | 0.000 | 0.000 | 0.000 | 0.539 | 0.000 | 0.000 | 0.461 | 0.000 | ||
| 1 spectrum, DQNVFDSK | 0.076 | 0.000 | 0.000 | 0.297 | 0.000 | 0.000 | 0.627 | 0.000 |
| Plot | Mito | Lyso or Perox | ER | Golgi | PM | Cytosol | Nucleus | ||||||
| Expt B |
9 peptides |
11 spectra |
 |
0.000 0.000 | 0.000 |
0.174 0.152 | 0.197 |
0.630 0.577 | 0.646 |
0.000 0.000 | 0.034 |
0.000 0.000 | 0.000 |
0.197 0.179 | 0.205 |
0.000 0.000 | 0.000 |
|||
| Plot | Lyso | Other | |||||||||||
| Expt C |
16 peptides |
47 spectra |
 |
0.000 0.000 | 0.000 |
1.000 1.000 | 1.000 |
||||||||
| Plot | Lyso | Other | |||||||||||
| Expt D |
5 peptides |
7 spectra |
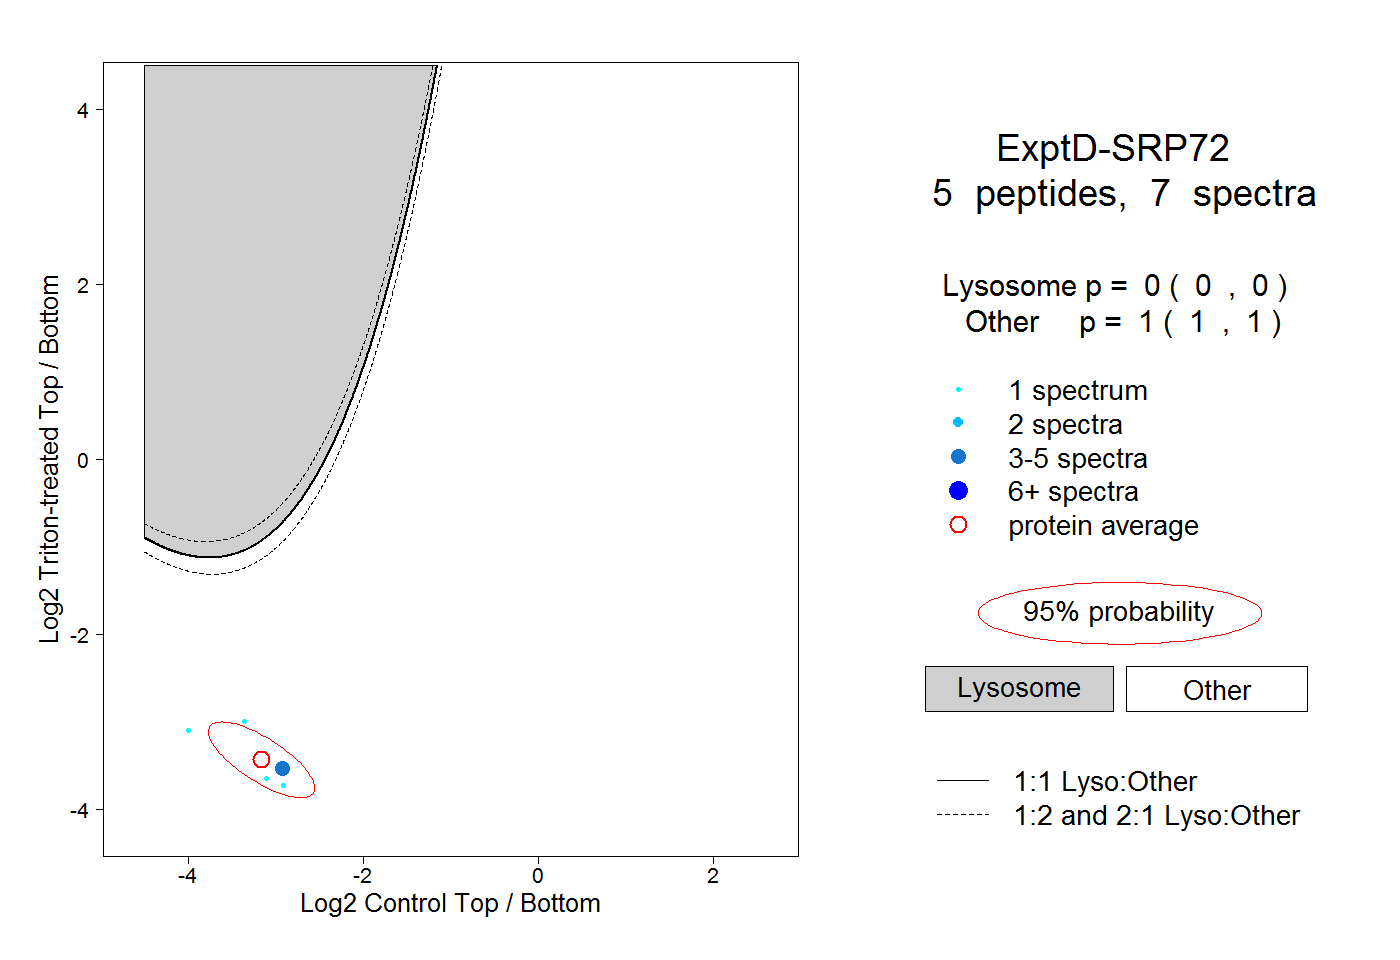 |
0.000 0.000 | 0.000 |
1.000 1.000 | 1.000 |