13
13peptides
spectra
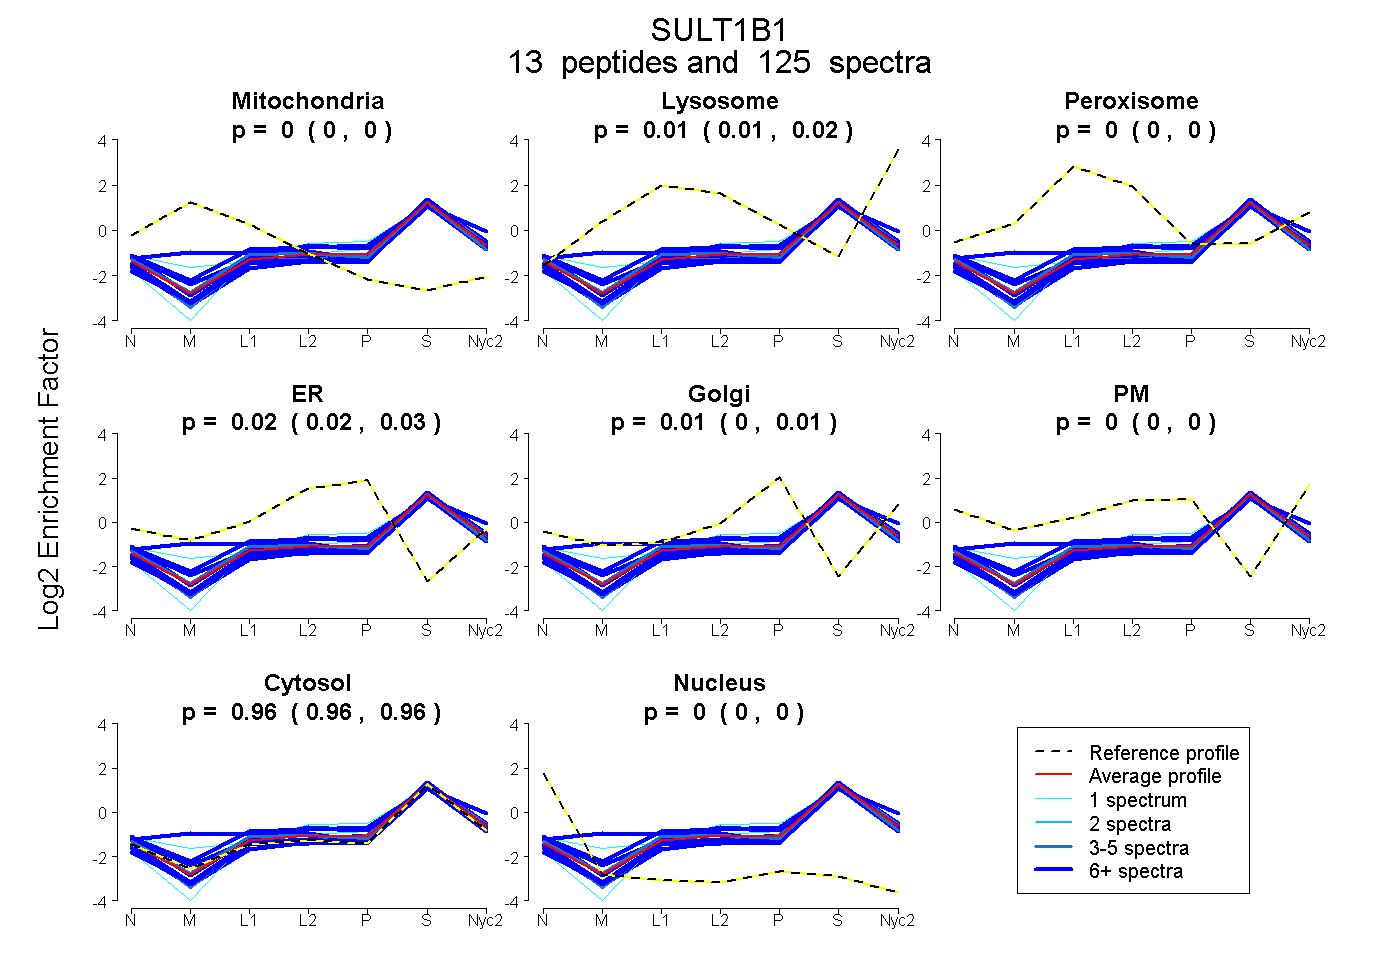
0.000 | 0.000
0.010 | 0.016
0.000 | 0.000
0.018 | 0.028
0.000 | 0.010
0.000 | 0.000
0.955 | 0.960
0.000 | 0.000
10peptides
spectra
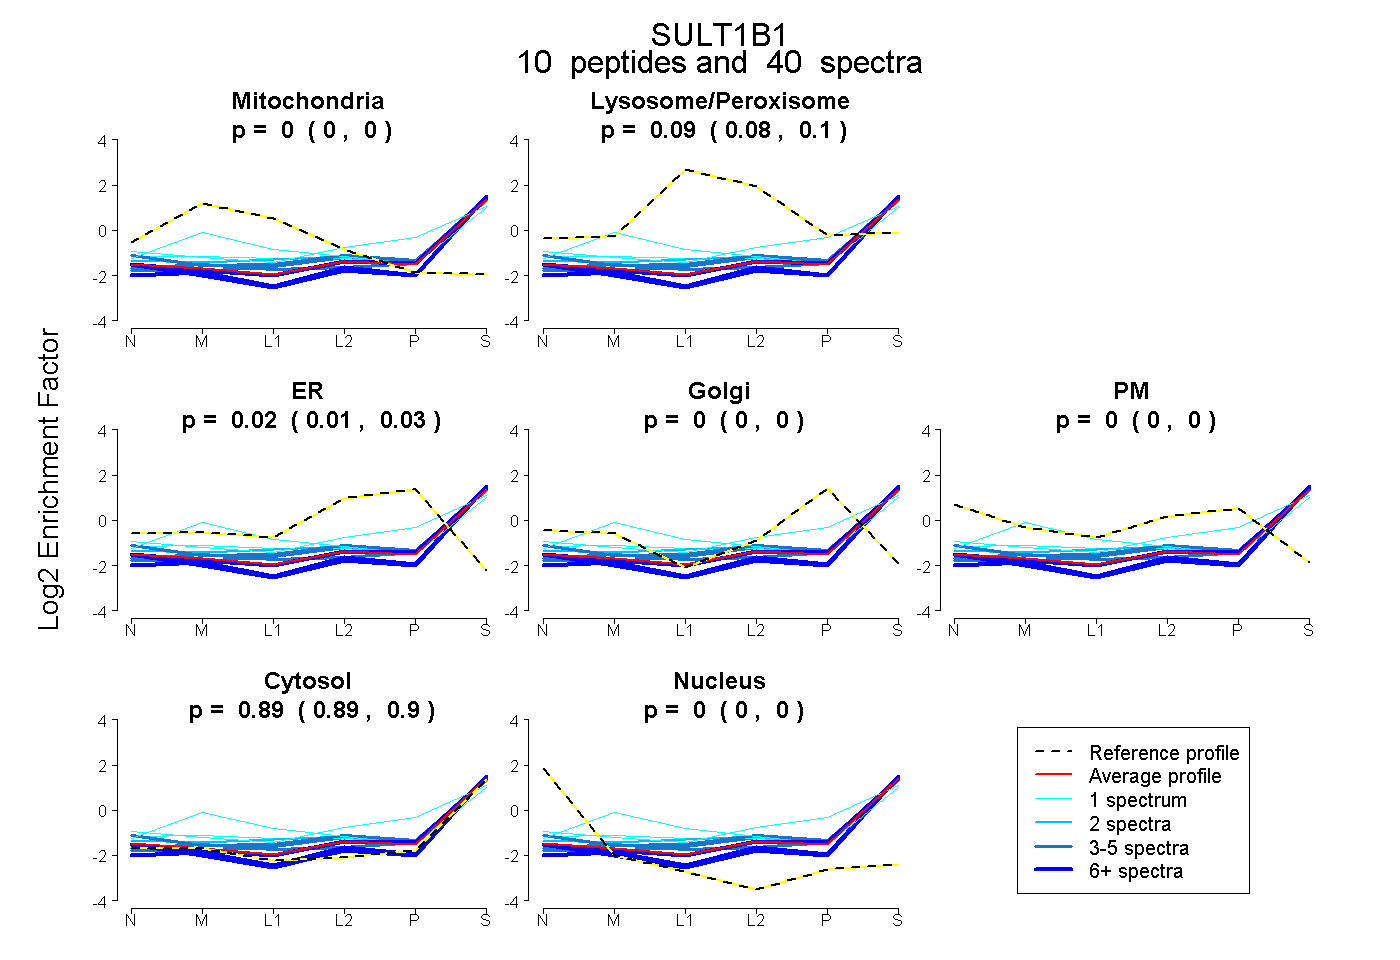
0.000 | 0.000
0.076 | 0.096
0.010 | 0.027
0.000 | 0.000
0.000 | 0.000
0.889 | 0.899
0.000 | 0.000
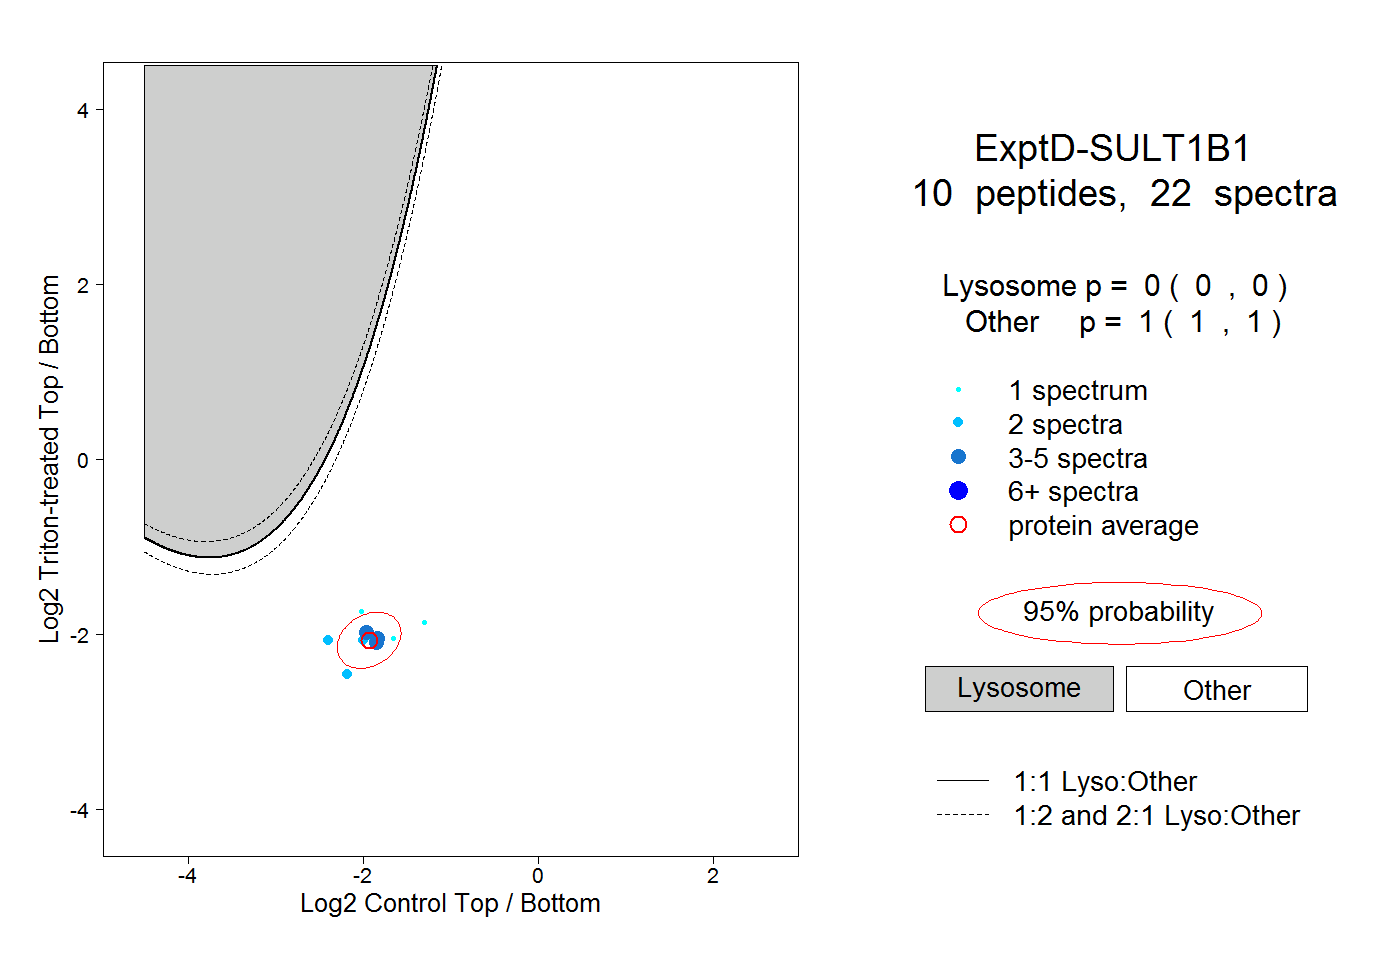
17peptides
spectra
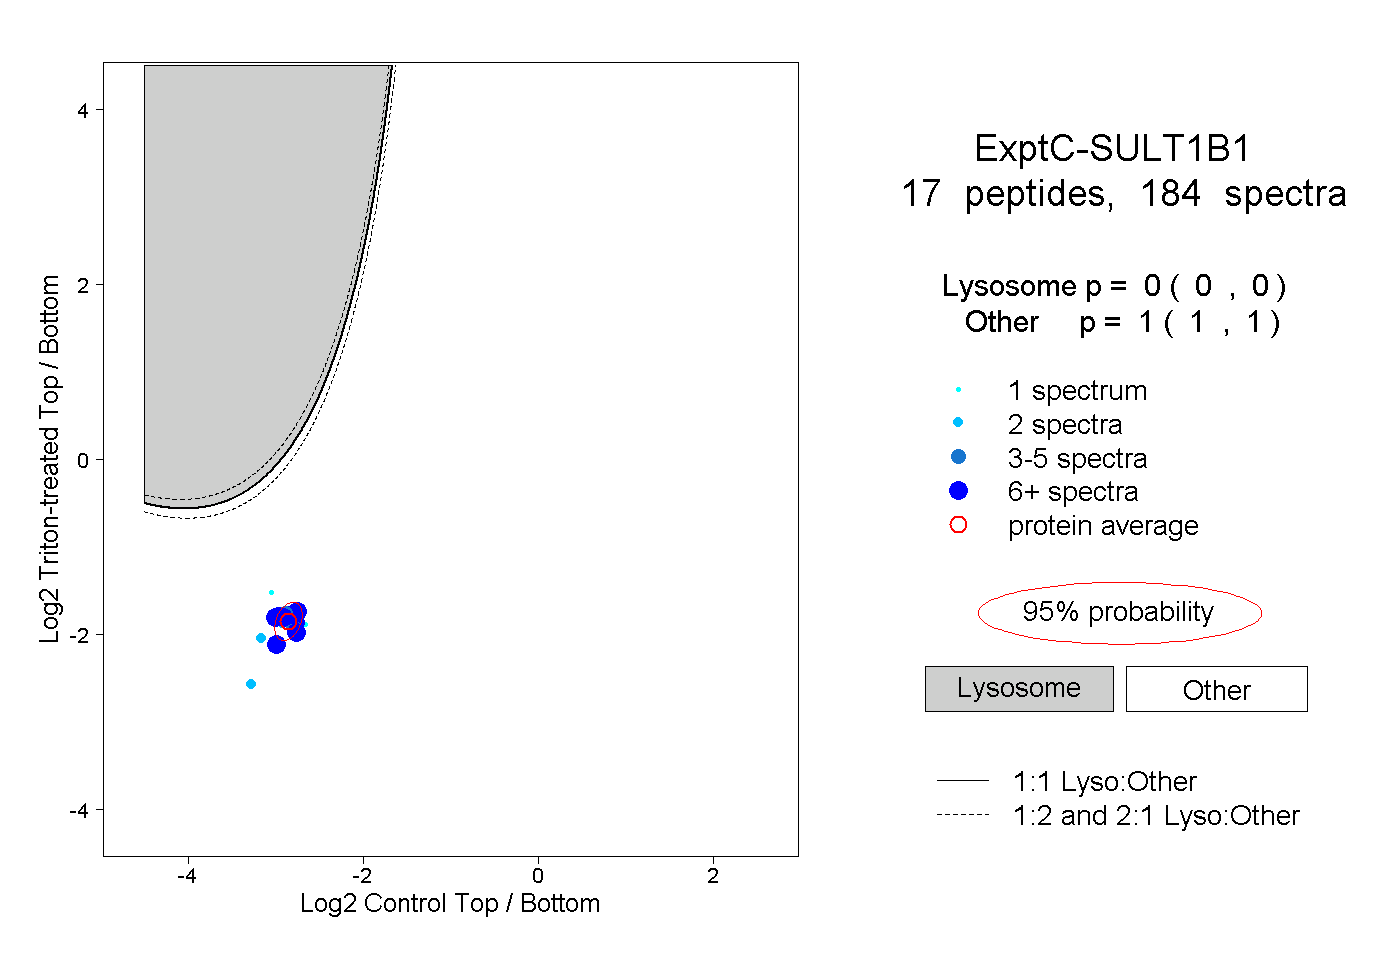
0.000 | 0.000
1.000 | 1.000