| 2 spectra, FLAGNVAYGSWFDHVK |
0.000 |
|
0.198 |
|
0.000 |
0.000 |
0.000 |
0.802 |
0.000 |
|
| 4 spectra, DNPLVNYTHLPTEIMDHSK |
0.000 |
|
0.097 |
|
0.000 |
0.000 |
0.000 |
0.903 |
0.000 |
|
| 3 spectra, IANFLDK |
0.000 |
|
0.169 |
|
0.000 |
0.000 |
0.030 |
0.801 |
0.000 |
|
| 3 spectra, EGHPILFLYYEDLK |
0.000 |
|
0.143 |
|
0.000 |
0.000 |
0.000 |
0.857 |
0.000 |
|
| 1 spectrum, VPMLEQNVPGAR |
0.000 |
|
0.204 |
|
0.000 |
0.196 |
0.000 |
0.599 |
0.000 |
|
| 10 spectra, TLDEHTLER |
0.000 |
|
0.073 |
|
0.029 |
0.000 |
0.000 |
0.898 |
0.000 |
|
| 1 spectrum, SGVELLK |
0.219 |
|
0.163 |
|
0.000 |
0.000 |
0.000 |
0.617 |
0.000 |
|
| 1 spectrum, FDAIYK |
0.001 |
|
0.207 |
|
0.000 |
0.000 |
0.003 |
0.788 |
0.000 |
|
| 8 spectra, MIYLAR |
0.000 |
|
0.000 |
|
0.000 |
0.000 |
0.000 |
1.000 |
0.000 |
|
| 7 spectra, IEEFQSRPCDIVIPTYPK |
0.000 |
|
0.000 |
|
0.000 |
0.000 |
0.000 |
0.994 |
0.006 |
|
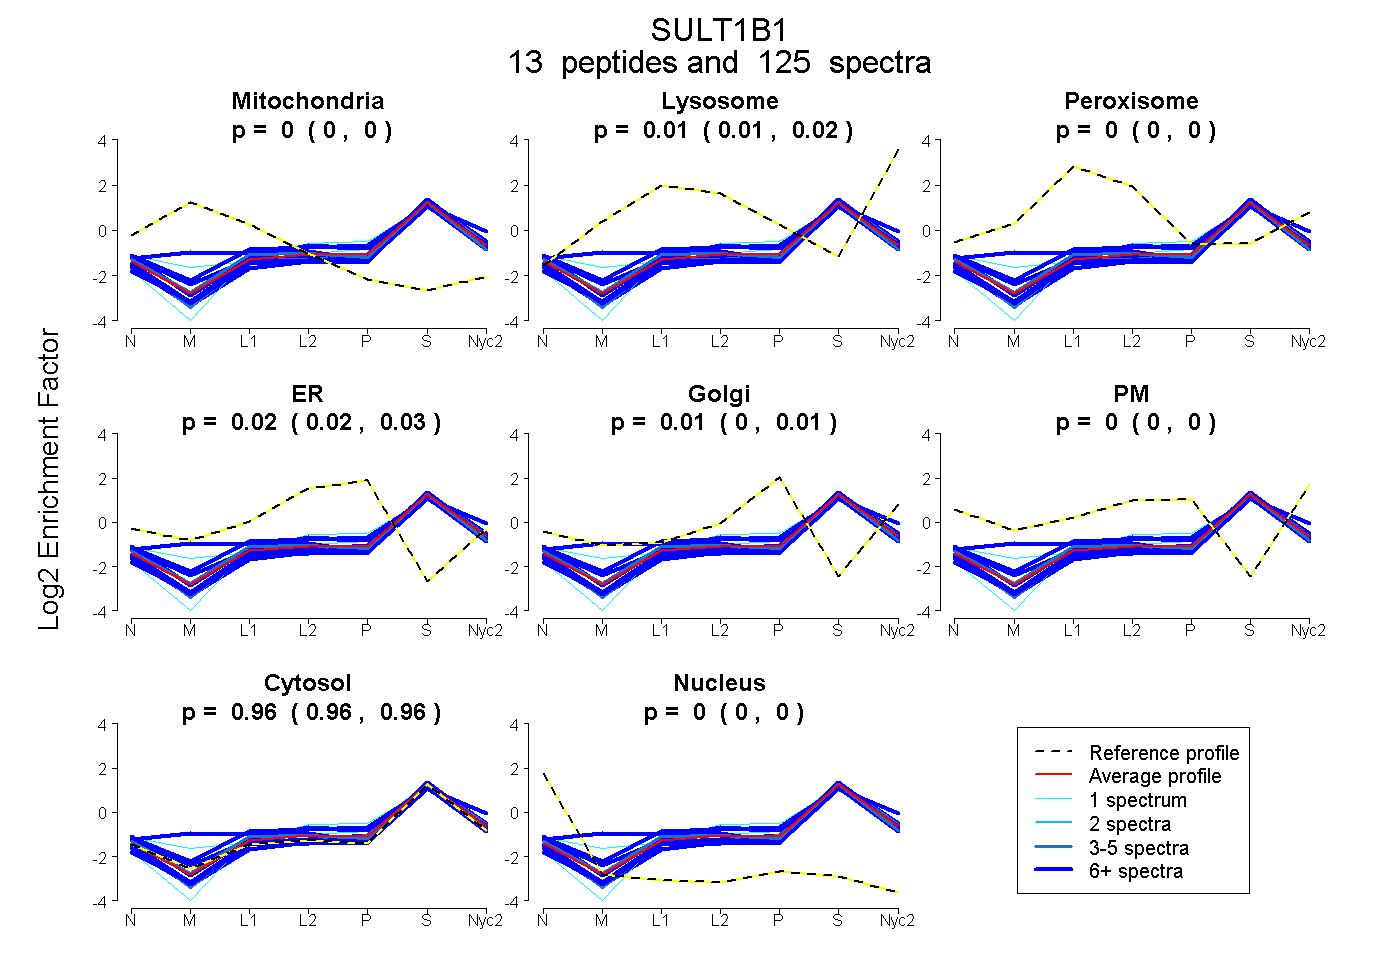
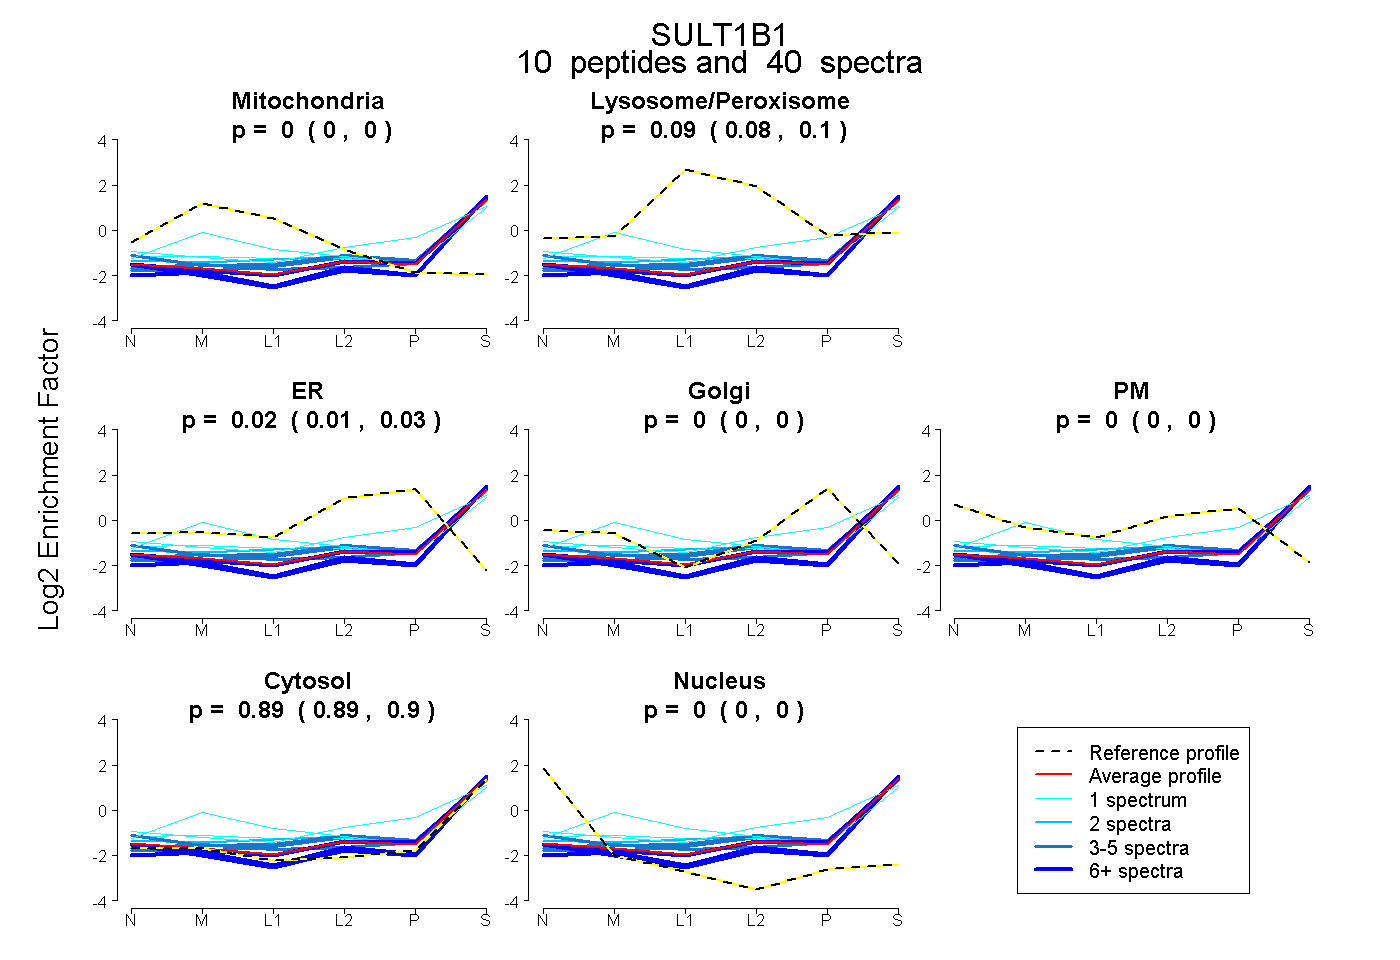
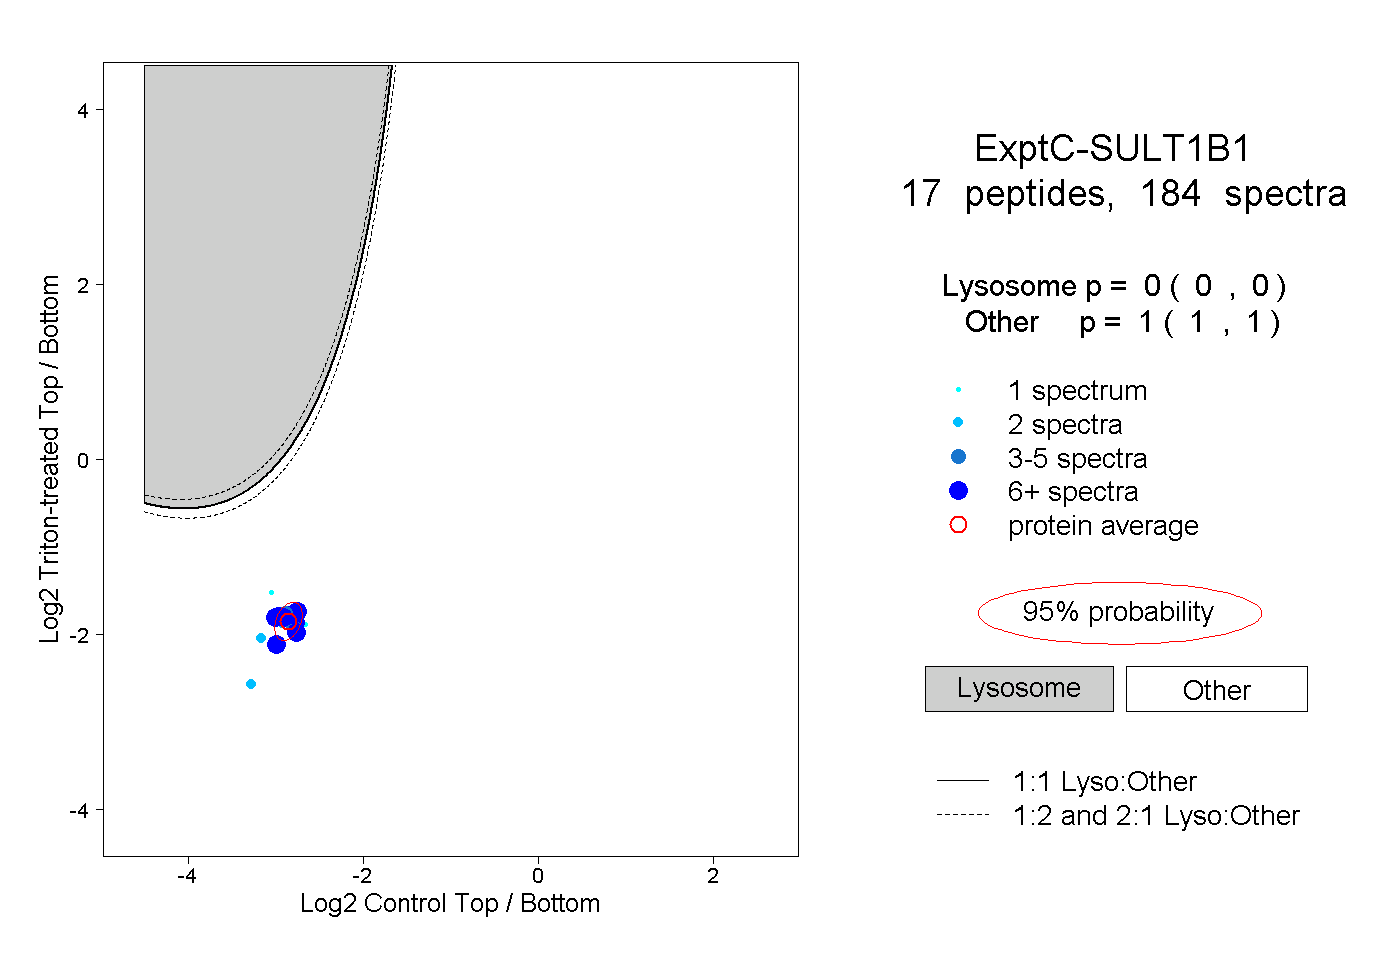
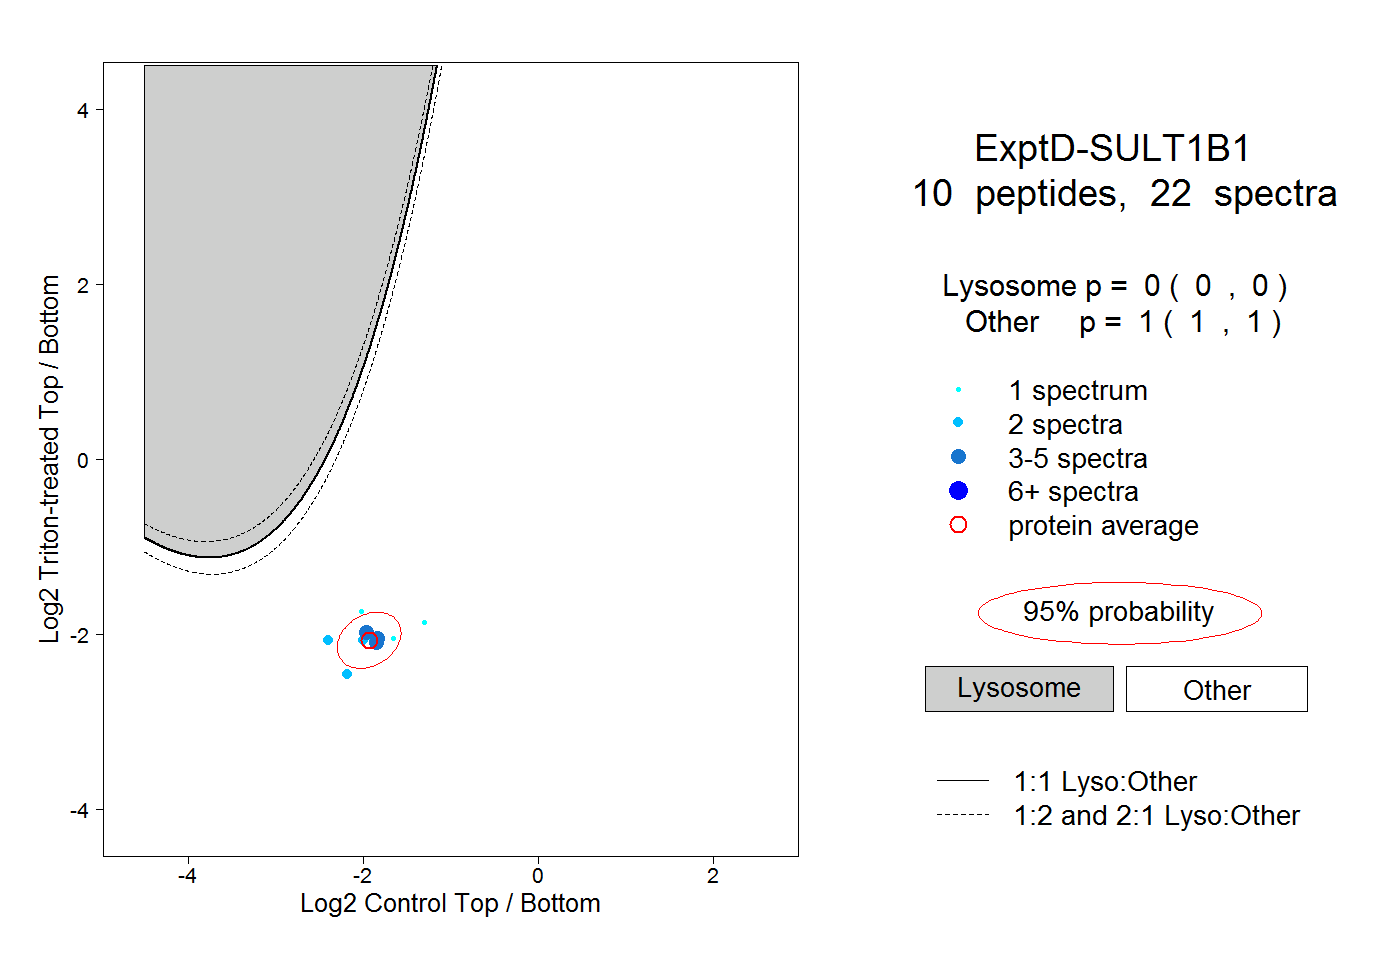
 13
13