 13
13peptides
spectra
0.000 | 0.000
0.010 | 0.016
0.000 | 0.000
0.018 | 0.028
0.000 | 0.010
0.000 | 0.000
0.955 | 0.960
0.000 | 0.000
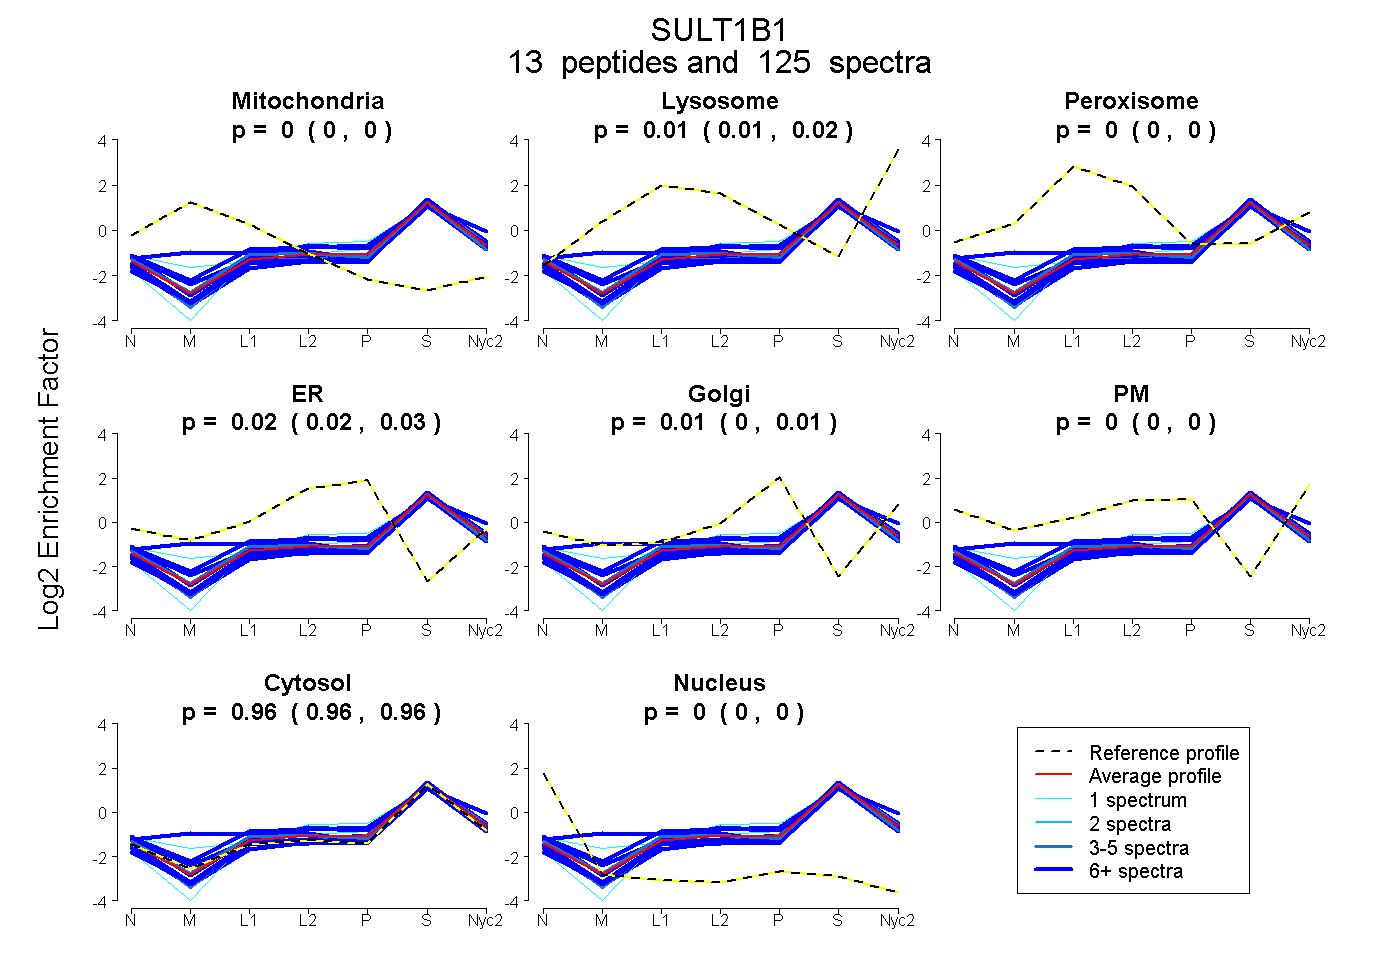
| Plot | Mito | Lyso | Perox | ER | Golgi | PM | Cytosol | Nucleus | |||||
| Expt A |
13 peptides |
125 spectra |
|
0.000 0.000 | 0.000 |
0.013 0.010 | 0.016 |
0.000 0.000 | 0.000 |
0.024 0.018 | 0.028 |
0.005 0.000 | 0.010 |
0.000 0.000 | 0.000 |
0.958 0.955 | 0.960 |
0.000 0.000 | 0.000 |
| 6 spectra, THLPIDLLPK | 0.000 | 0.000 | 0.001 | 0.118 | 0.000 | 0.000 | 0.881 | 0.000 | ||
| 5 spectra, GVVGDWK | 0.000 | 0.000 | 0.000 | 0.000 | 0.000 | 0.000 | 1.000 | 0.000 | ||
| 9 spectra, SFWDNK | 0.000 | 0.000 | 0.000 | 0.000 | 0.000 | 0.000 | 1.000 | 0.000 | ||
| 8 spectra, NYFTMTQSEK | 0.000 | 0.123 | 0.000 | 0.000 | 0.031 | 0.035 | 0.811 | 0.000 | ||
| 1 spectrum, FLAGNVAYGSWFDHVK | 0.000 | 0.000 | 0.000 | 0.000 | 0.000 | 0.000 | 1.000 | 0.000 | ||
| 13 spectra, DNPLVNYTHLPTEIMDHSK | 0.000 | 0.000 | 0.000 | 0.000 | 0.015 | 0.000 | 0.985 | 0.000 | ||
| 13 spectra, IANFLDK | 0.145 | 0.061 | 0.044 | 0.000 | 0.000 | 0.000 | 0.750 | 0.000 | ||
| 1 spectrum, EGHPILFLYYEDLK | 0.000 | 0.027 | 0.016 | 0.143 | 0.010 | 0.000 | 0.804 | 0.000 | ||
| 5 spectra, VPMLEQNVPGAR | 0.000 | 0.000 | 0.035 | 0.013 | 0.000 | 0.000 | 0.952 | 0.000 | ||
| 20 spectra, TLDEHTLER | 0.000 | 0.000 | 0.000 | 0.100 | 0.000 | 0.000 | 0.900 | 0.000 | ||
| 8 spectra, DVITSK | 0.000 | 0.000 | 0.000 | 0.000 | 0.000 | 0.000 | 1.000 | 0.000 | ||
| 6 spectra, FDAIYK | 0.000 | 0.000 | 0.000 | 0.000 | 0.000 | 0.000 | 1.000 | 0.000 | ||
| 30 spectra, MIYLAR | 0.000 | 0.000 | 0.000 | 0.000 | 0.000 | 0.000 | 1.000 | 0.000 |
| Plot | Mito | Lyso or Perox | ER | Golgi | PM | Cytosol | Nucleus | ||||||
| Expt B |
10 peptides |
40 spectra |
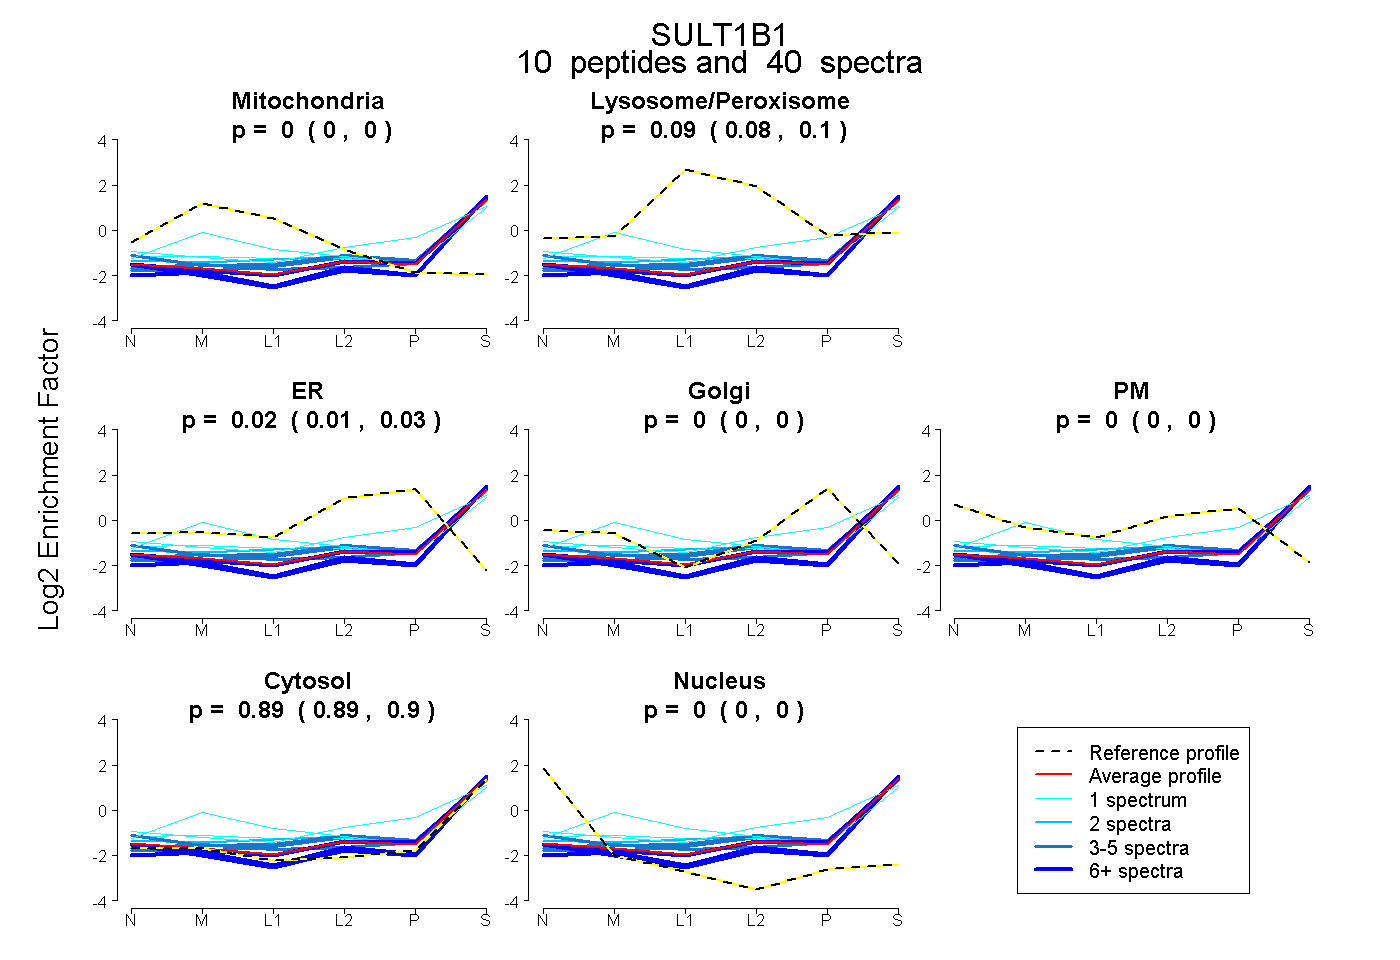 |
0.000 0.000 | 0.000 |
0.087 0.076 | 0.096 |
0.019 0.010 | 0.027 |
0.000 0.000 | 0.000 |
0.000 0.000 | 0.000 |
0.894 0.889 | 0.899 |
0.000 0.000 | 0.000 |
|||
| Plot | Lyso | Other | |||||||||||
| Expt C |
17 peptides |
184 spectra |
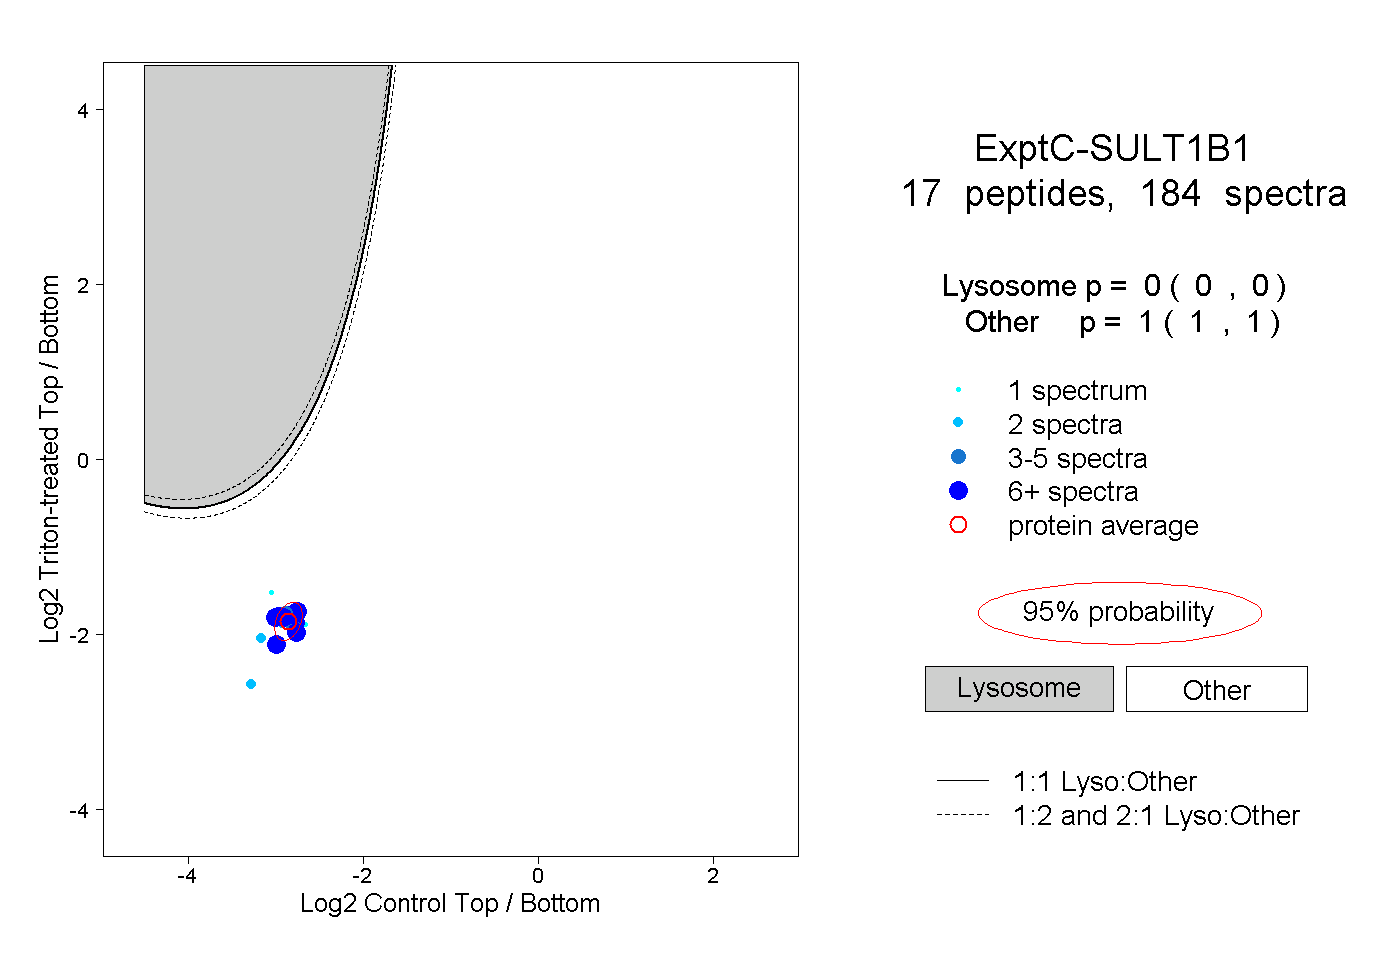 |
0.000 0.000 | 0.000 |
1.000 1.000 | 1.000 |
||||||||
| Plot | Lyso | Other | |||||||||||
| Expt D |
10 peptides |
22 spectra |
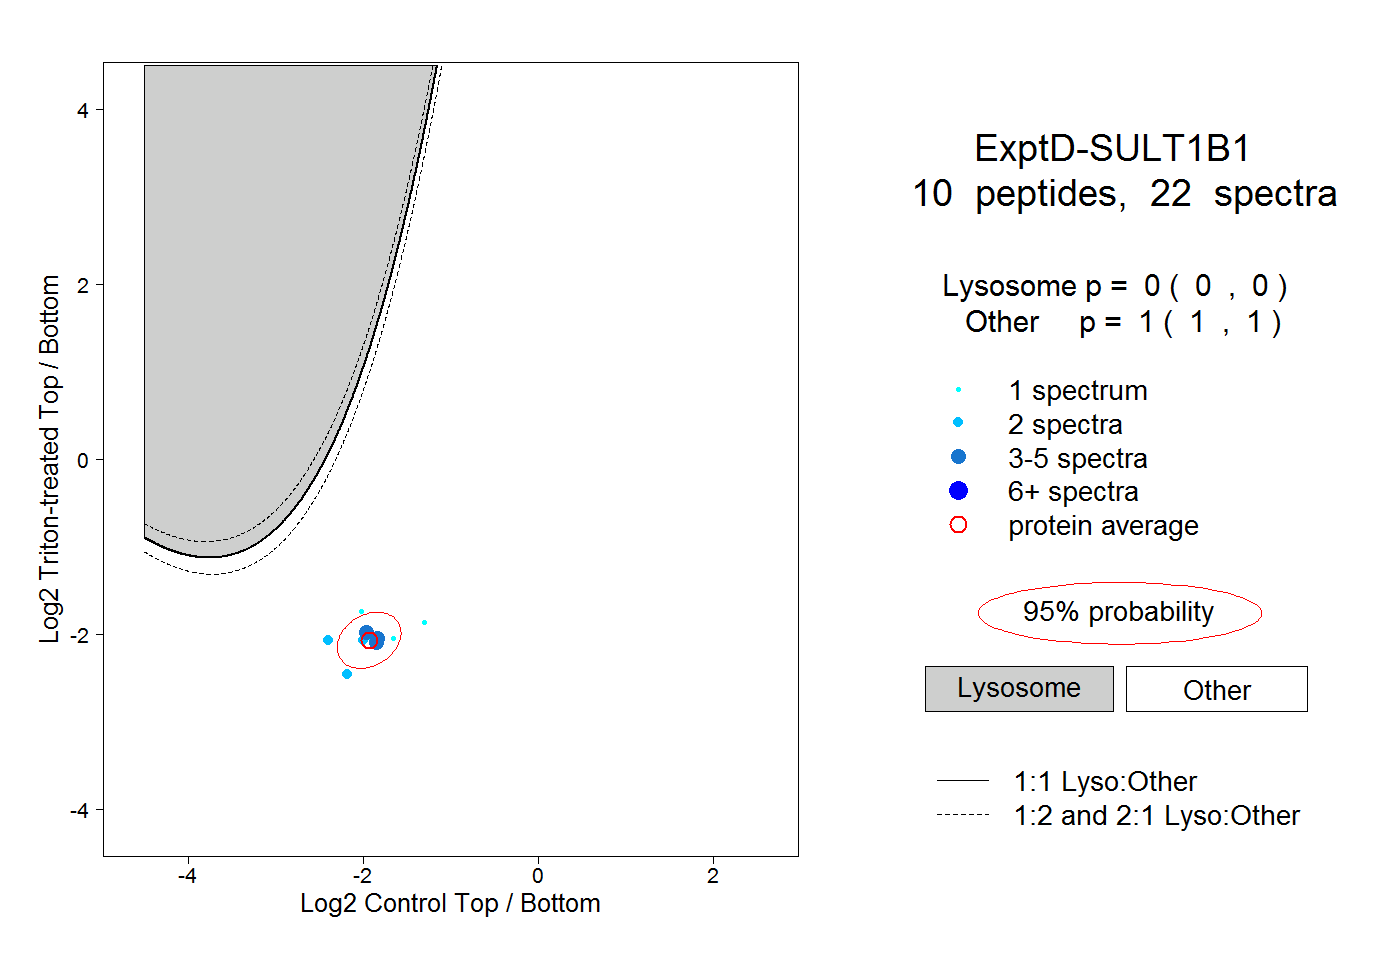 |
0.000 0.000 | 0.000 |
1.000 1.000 | 1.000 |