 4
4peptides
spectra
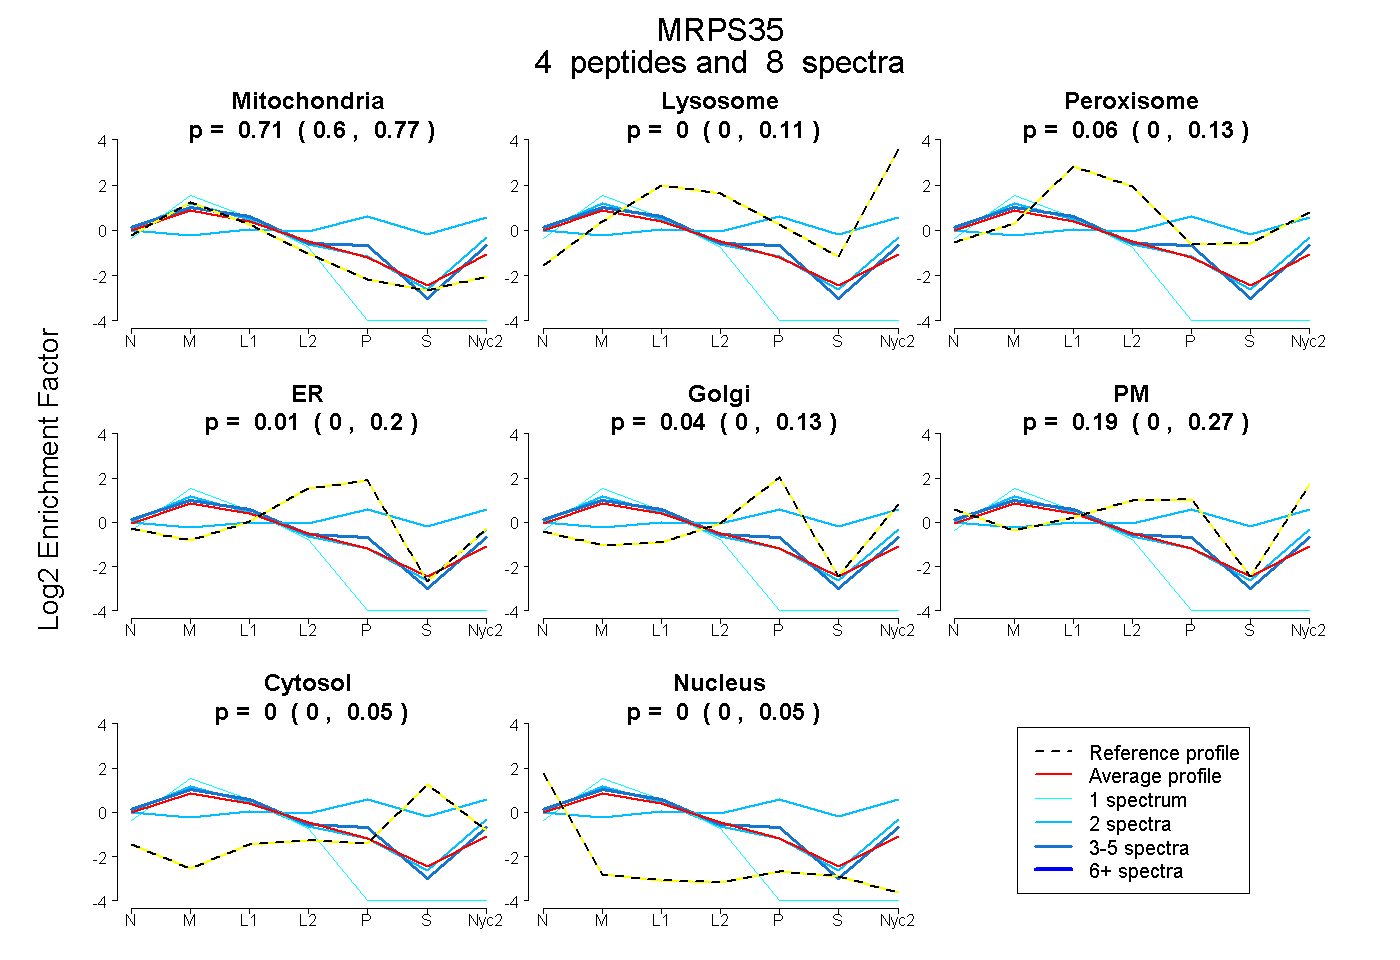
0.595 | 0.769
0.000 | 0.109
0.000 | 0.132
0.000 | 0.196
0.000 | 0.129
0.000 | 0.271
0.000 | 0.046
0.000 | 0.051
1peptide
spectrum
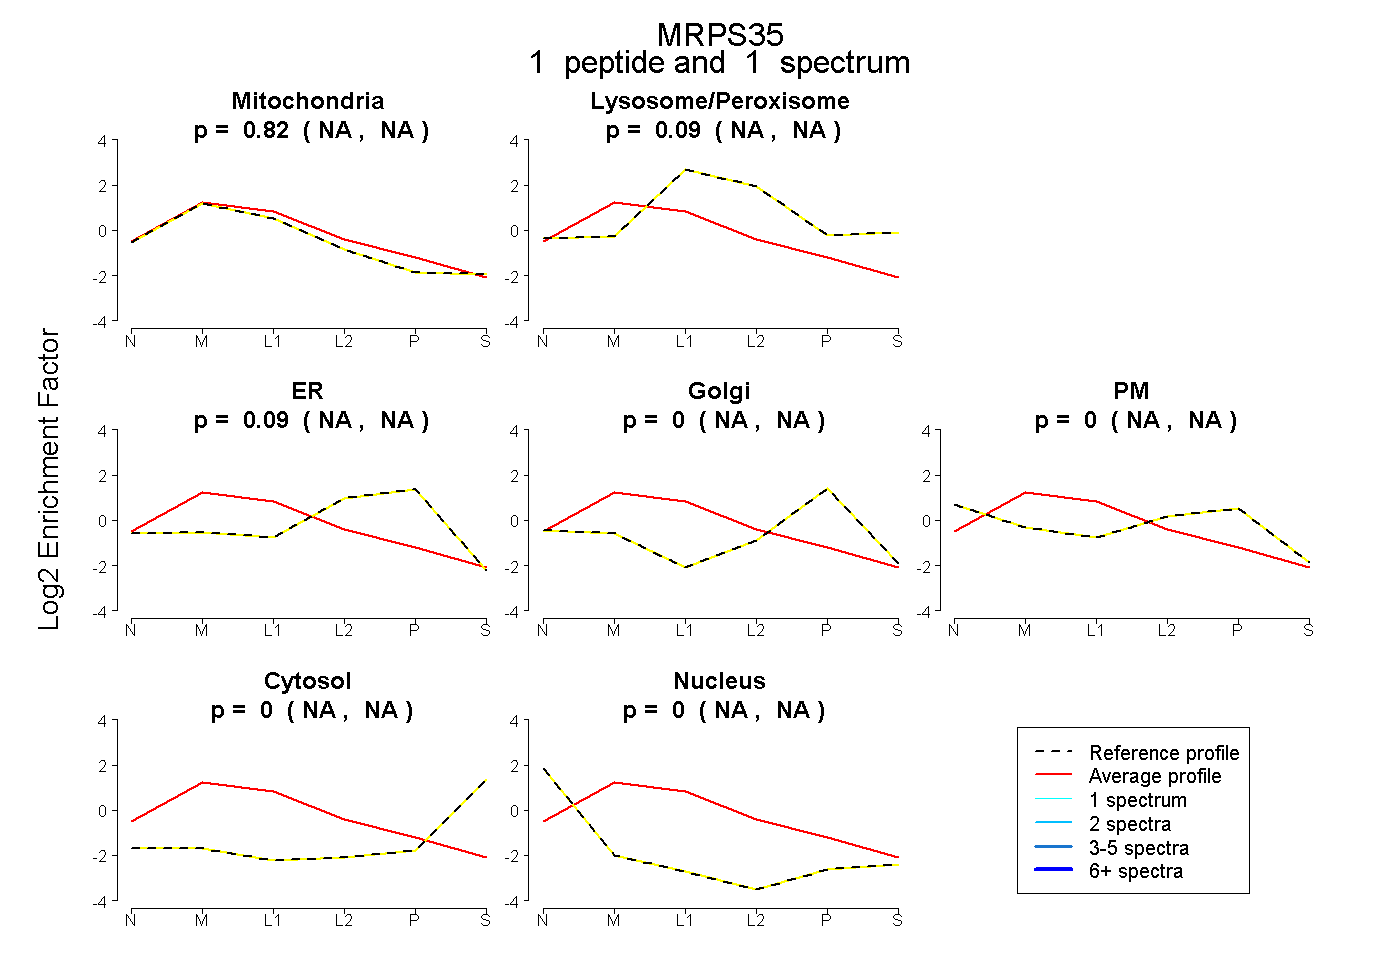
NA | NA
NA | NA
NA | NA
NA | NA
NA | NA
NA | NA
NA | NA
8peptides
spectra
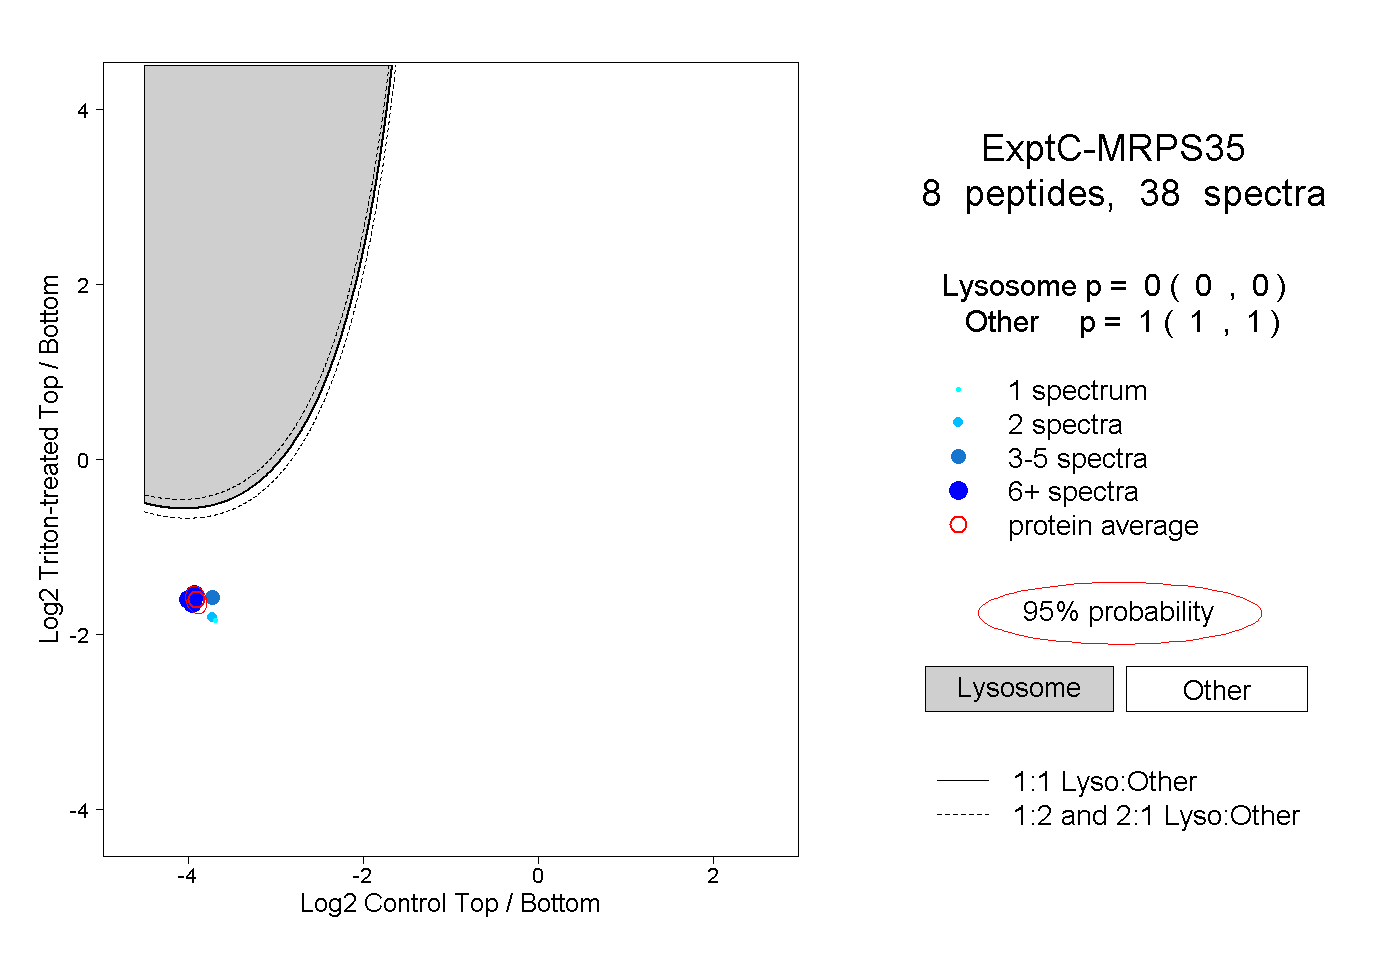
0.000 | 0.000
1.000 | 1.000
4peptides
spectra
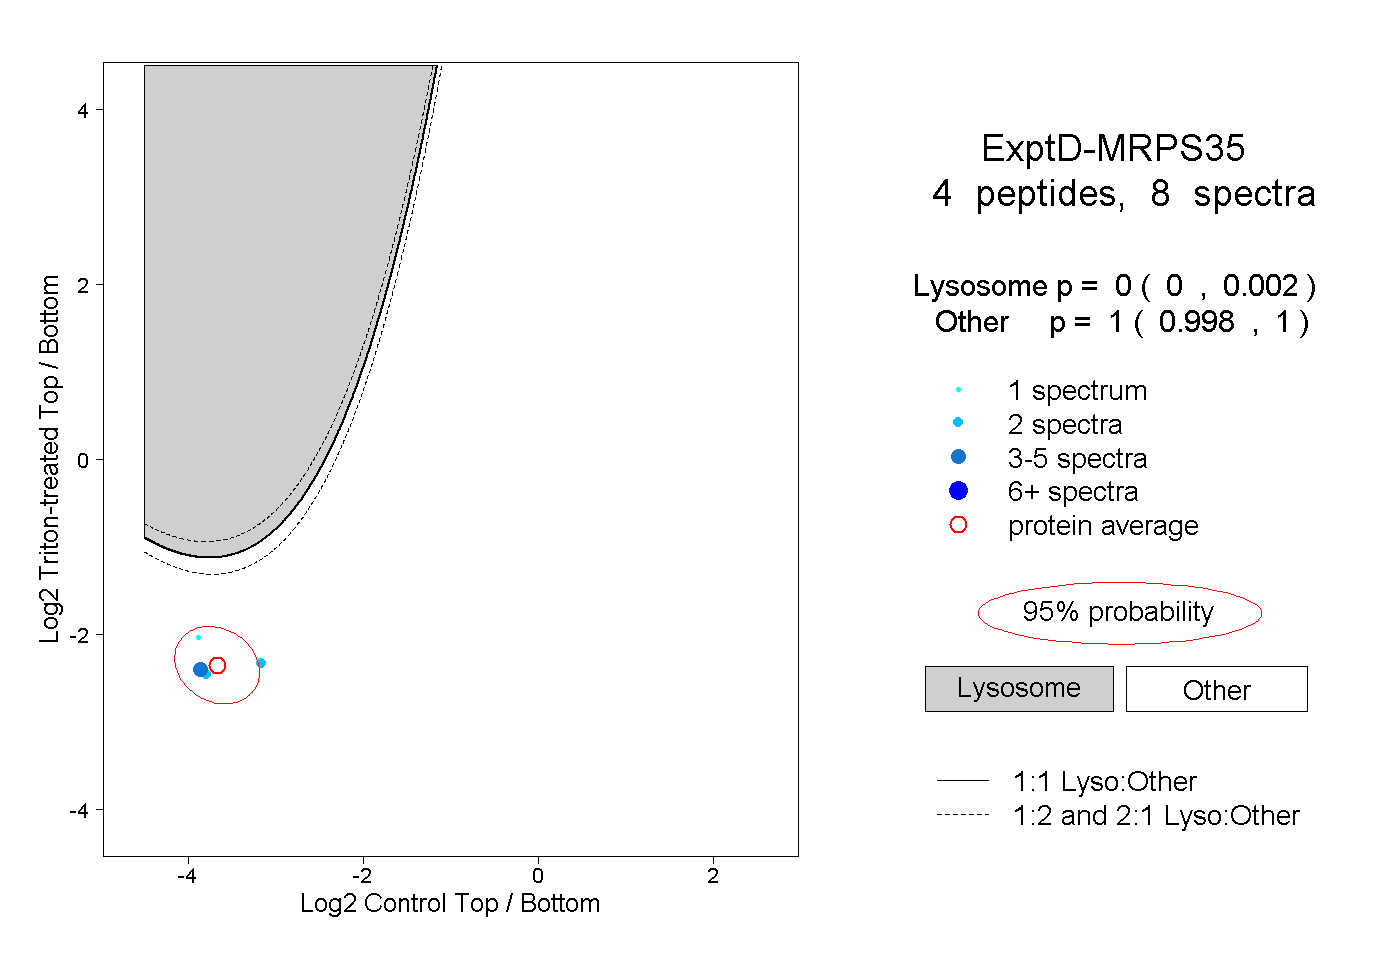
0.000 | 0.002
0.998 | 1.000