 8
8peptides
spectra
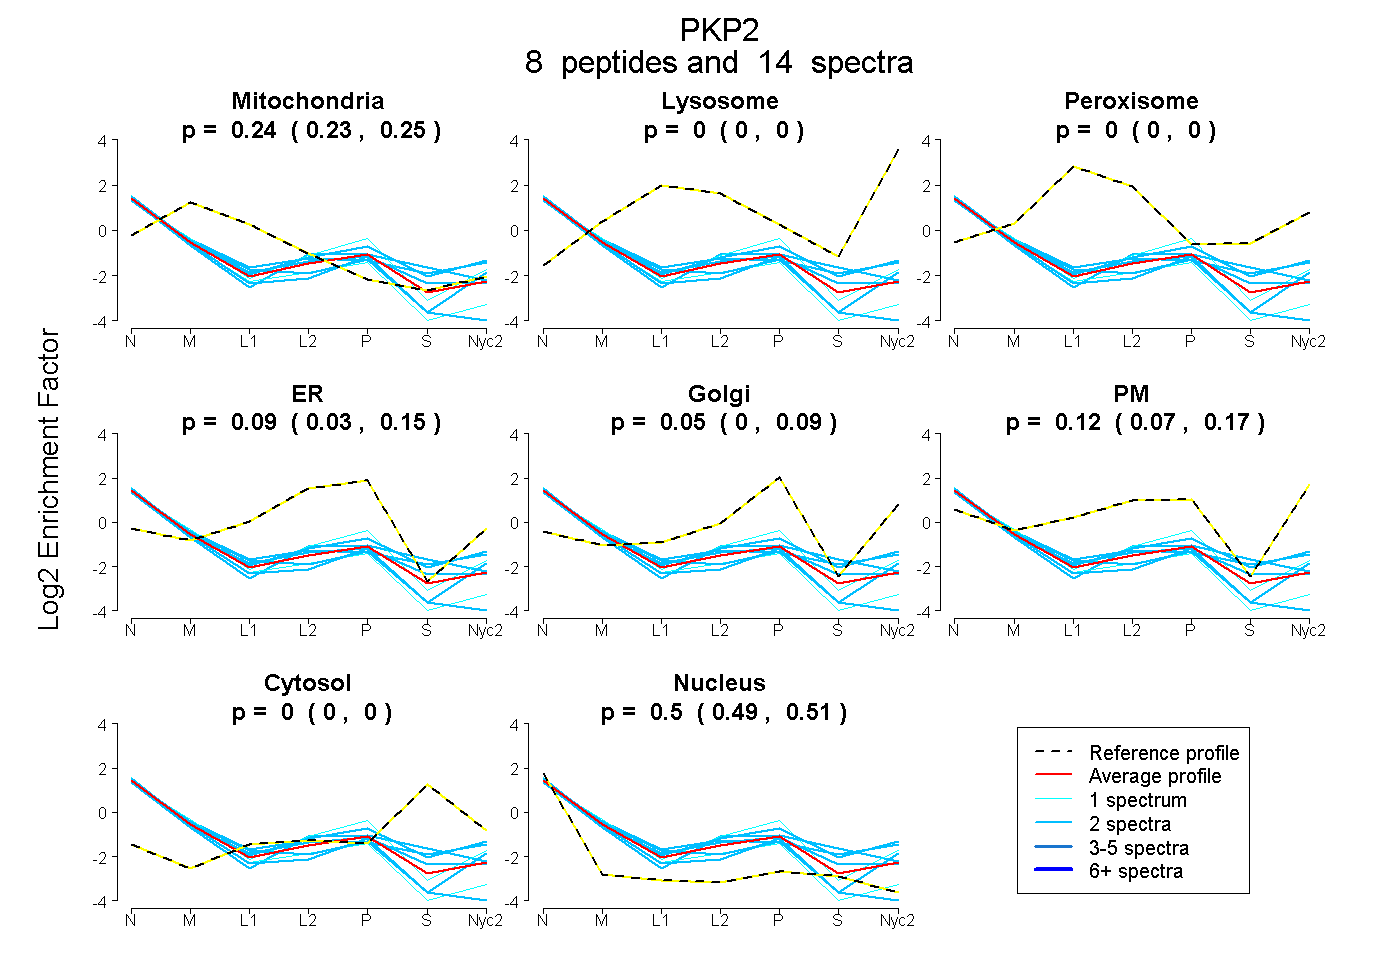
0.227 | 0.252
0.000 | 0.000
0.000 | 0.000
0.028 | 0.145
0.000 | 0.085
0.068 | 0.167
0.000 | 0.000
0.489 | 0.507
1peptide
spectrum

NA | NA
NA | NA
NA | NA
NA | NA
NA | NA
NA | NA
NA | NA
2peptides
spectra
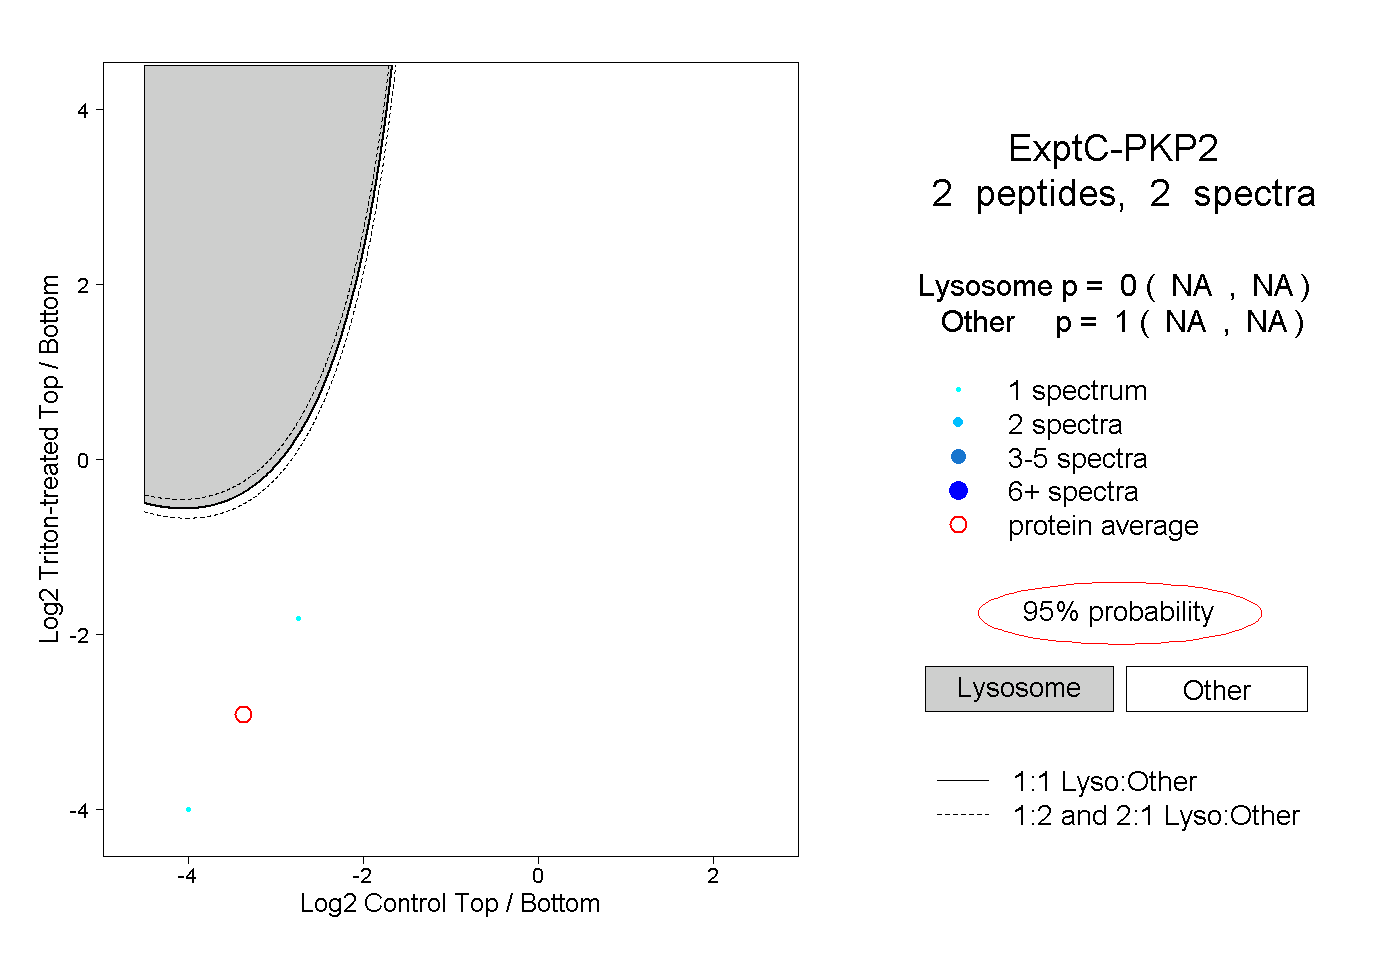
NA | NA
NA | NA