 1
1peptide
spectra
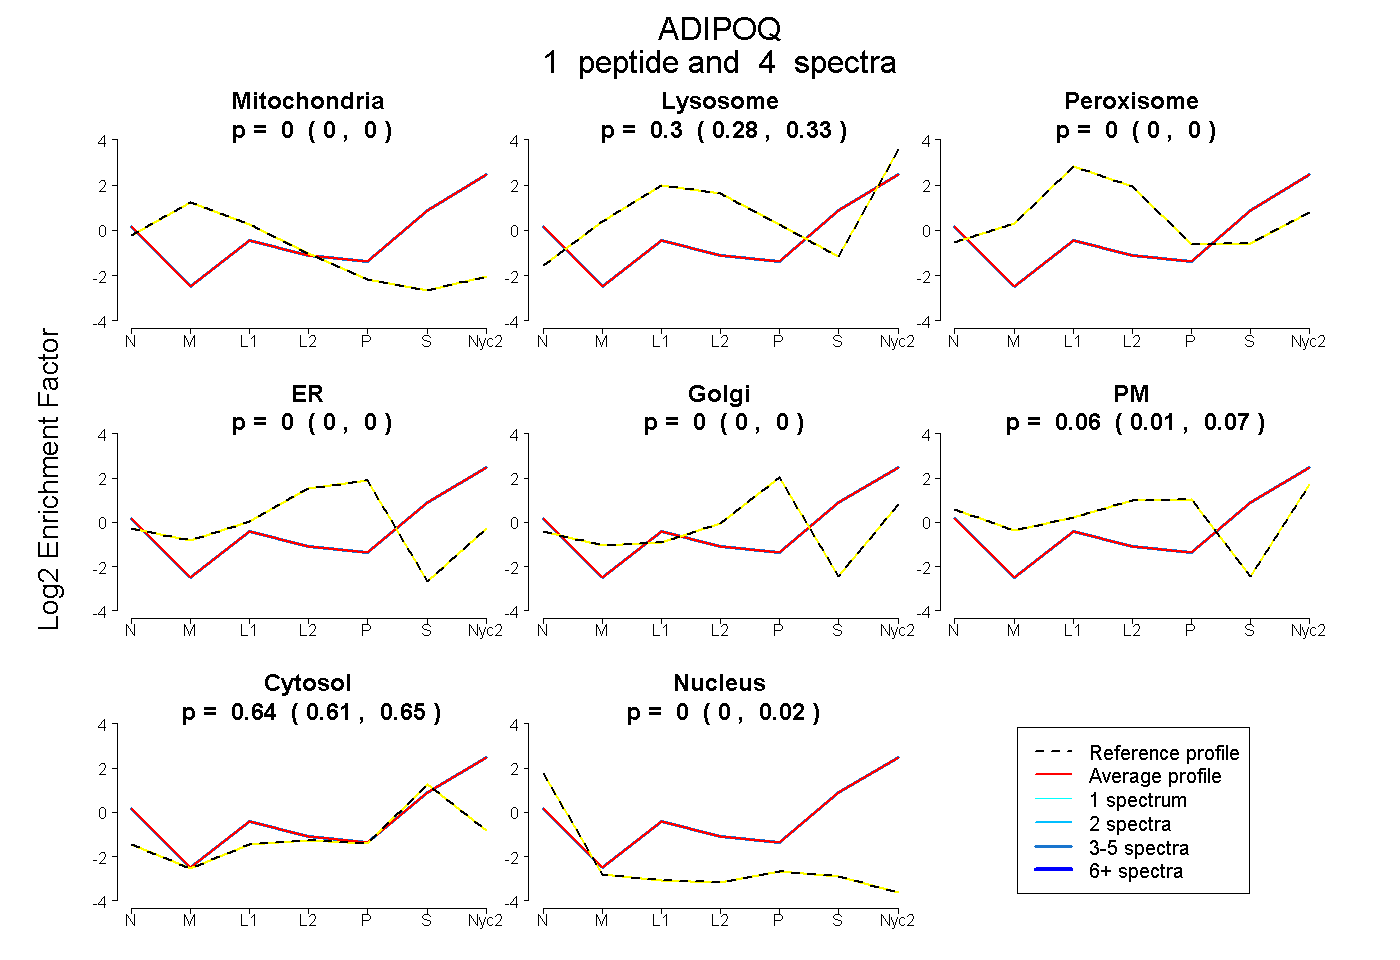
0.000 | 0.000
0.278 | 0.335
0.000 | 0.000
0.000 | 0.000
0.000 | 0.000
0.015 | 0.074
0.613 | 0.653
0.000 | 0.020
1peptide
spectrum
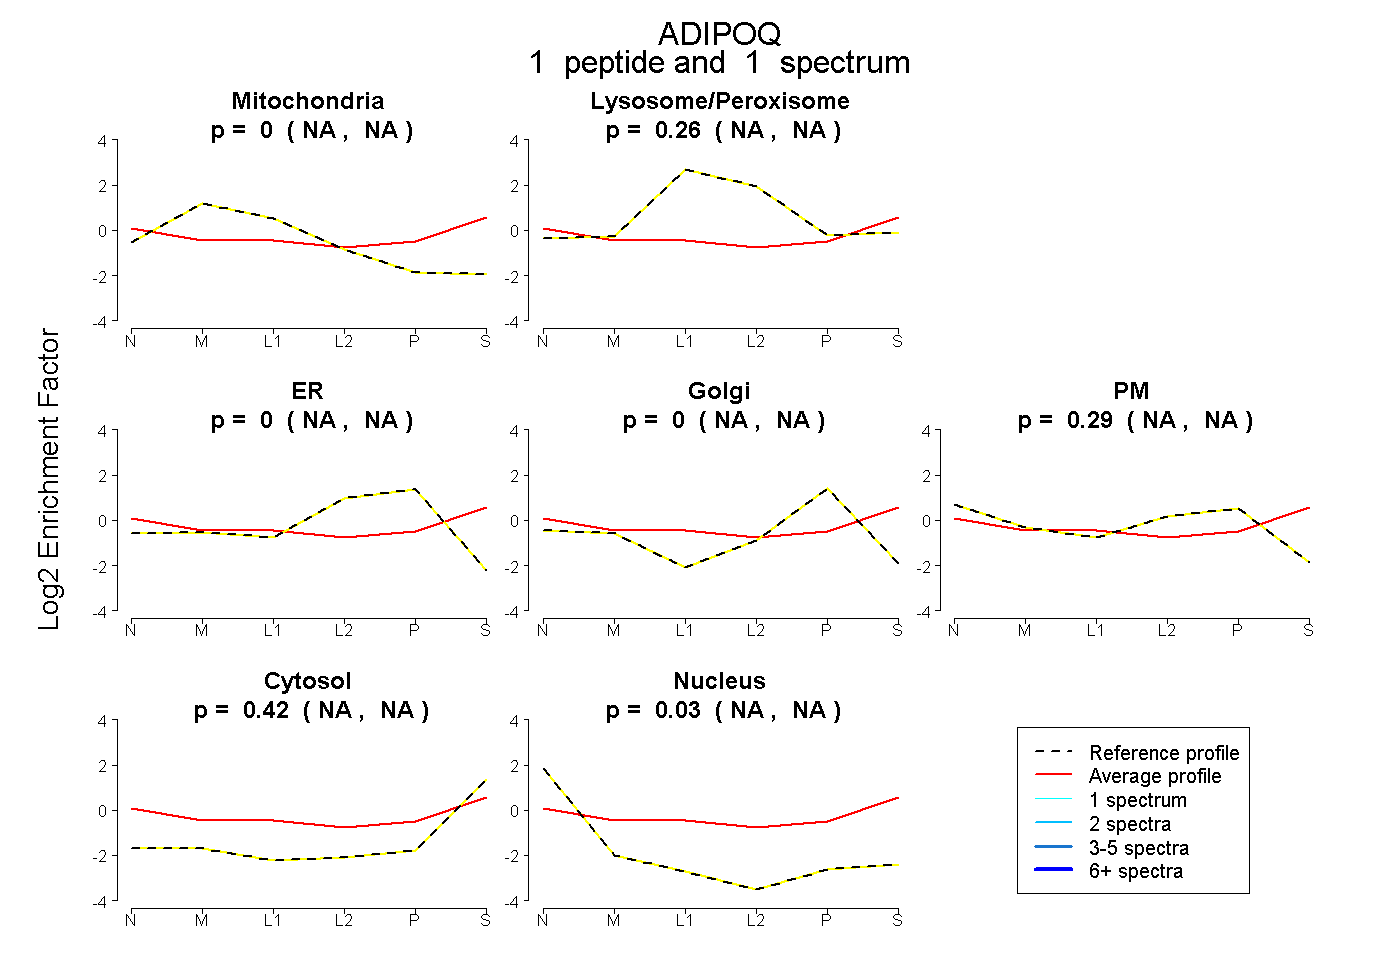
NA | NA
NA | NA
NA | NA
NA | NA
NA | NA
NA | NA
NA | NA
2peptides
spectra
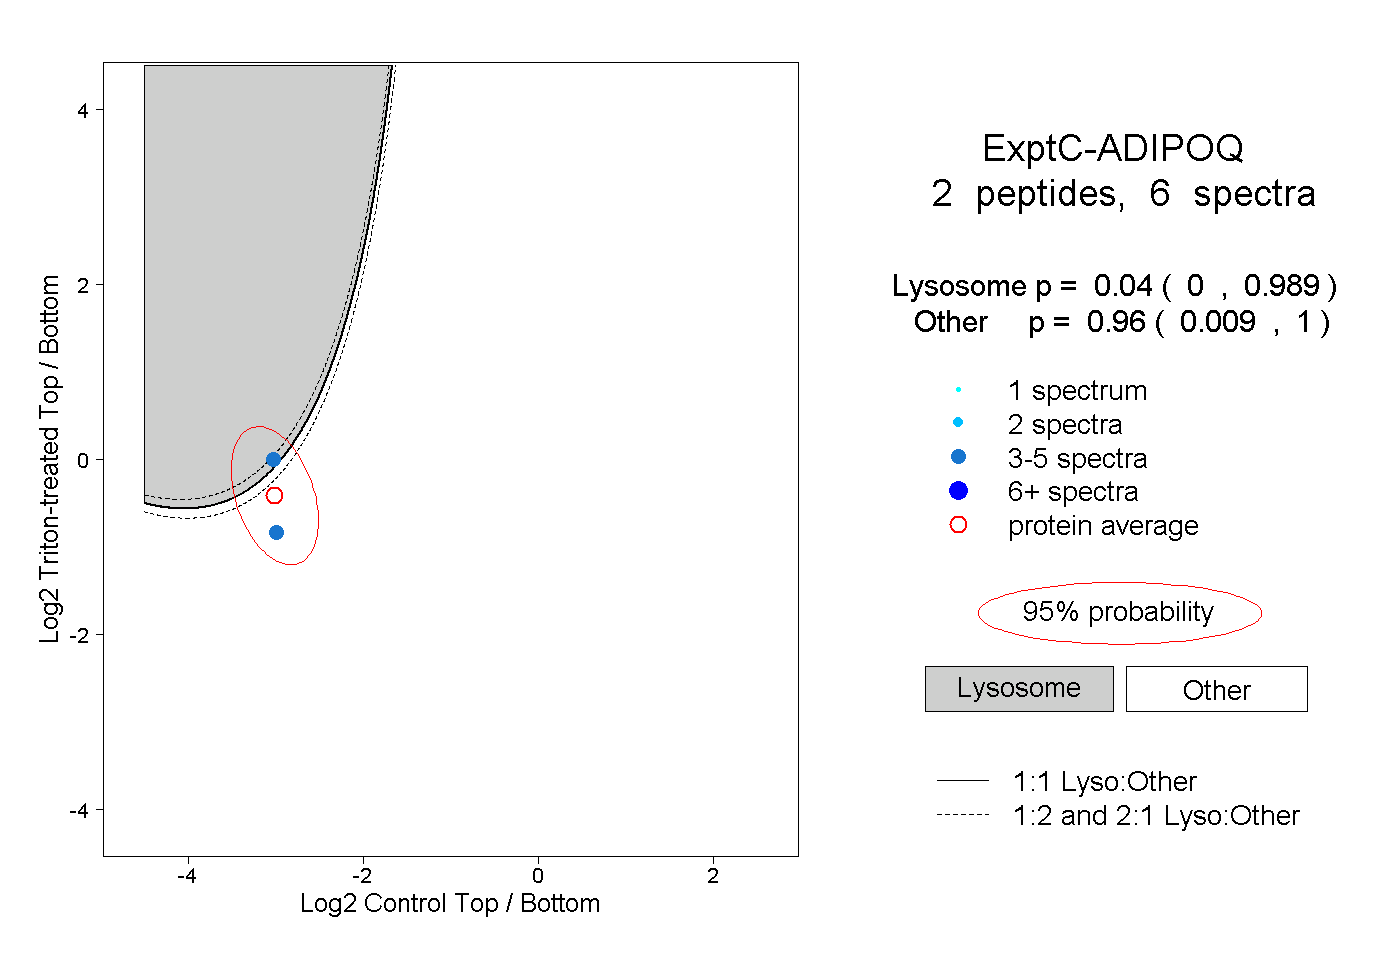
0.000 | 0.989
0.009 | 1.000