 6
6peptides
spectra
0.000 | 0.000
0.000 | 0.000
0.468 | 0.506
0.143 | 0.177
0.000 | 0.000
0.000 | 0.000
0.040 | 0.084
0.272 | 0.300
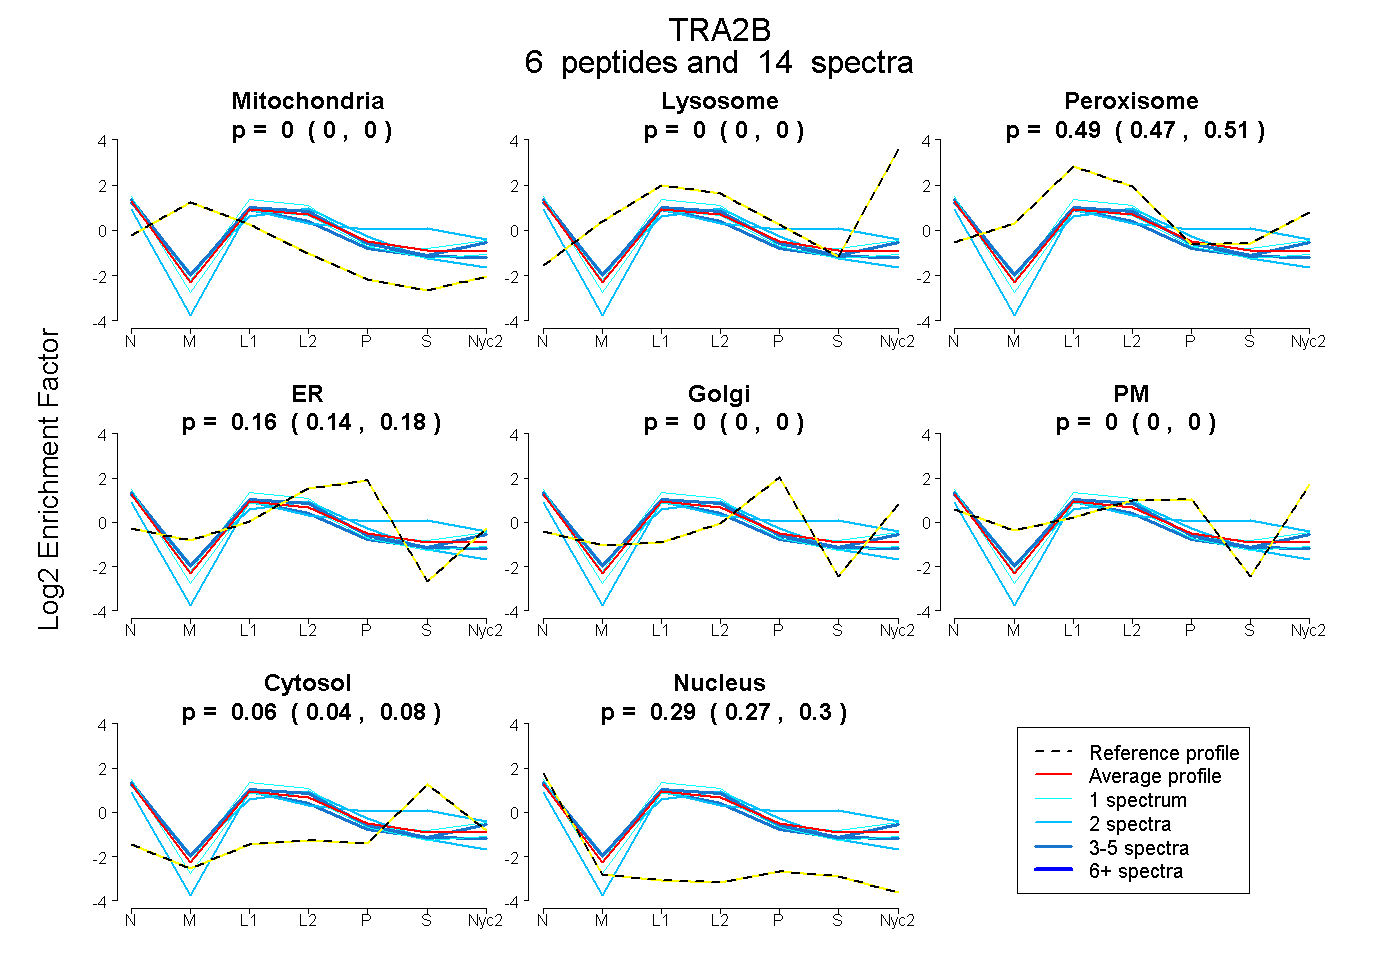
| Plot | Mito | Lyso | Perox | ER | Golgi | PM | Cytosol | Nucleus | |||||
| Expt A |
6 peptides |
14 spectra |
|
0.000 0.000 | 0.000 |
0.000 0.000 | 0.000 |
0.489 0.468 | 0.506 |
0.161 0.143 | 0.177 |
0.000 0.000 | 0.000 |
0.000 0.000 | 0.000 |
0.064 0.040 | 0.084 |
0.287 0.272 | 0.300 |
| 1 spectrum, YGPIADVSIVYDQQSR | 0.000 | 0.000 | 0.480 | 0.155 | 0.000 | 0.000 | 0.008 | 0.357 | ||
| 3 spectra, VDFSITK | 0.000 | 0.000 | 0.533 | 0.089 | 0.000 | 0.088 | 0.000 | 0.290 | ||
| 1 spectrum, ANGMELDGR | 0.000 | 0.000 | 0.614 | 0.075 | 0.000 | 0.022 | 0.031 | 0.258 | ||
| 2 spectra, ANGIELDGR | 0.000 | 0.000 | 0.411 | 0.268 | 0.000 | 0.000 | 0.000 | 0.322 | ||
| 5 spectra, GFAFVYFENVDDAK | 0.000 | 0.000 | 0.548 | 0.088 | 0.000 | 0.000 | 0.000 | 0.364 | ||
| 2 spectra, SPSPYYSR | 0.000 | 0.000 | 0.246 | 0.204 | 0.000 | 0.037 | 0.431 | 0.082 |
| Plot | Mito | Lyso or Perox | ER | Golgi | PM | Cytosol | Nucleus | ||||||
| Expt B |
1 peptide |
1 spectrum |
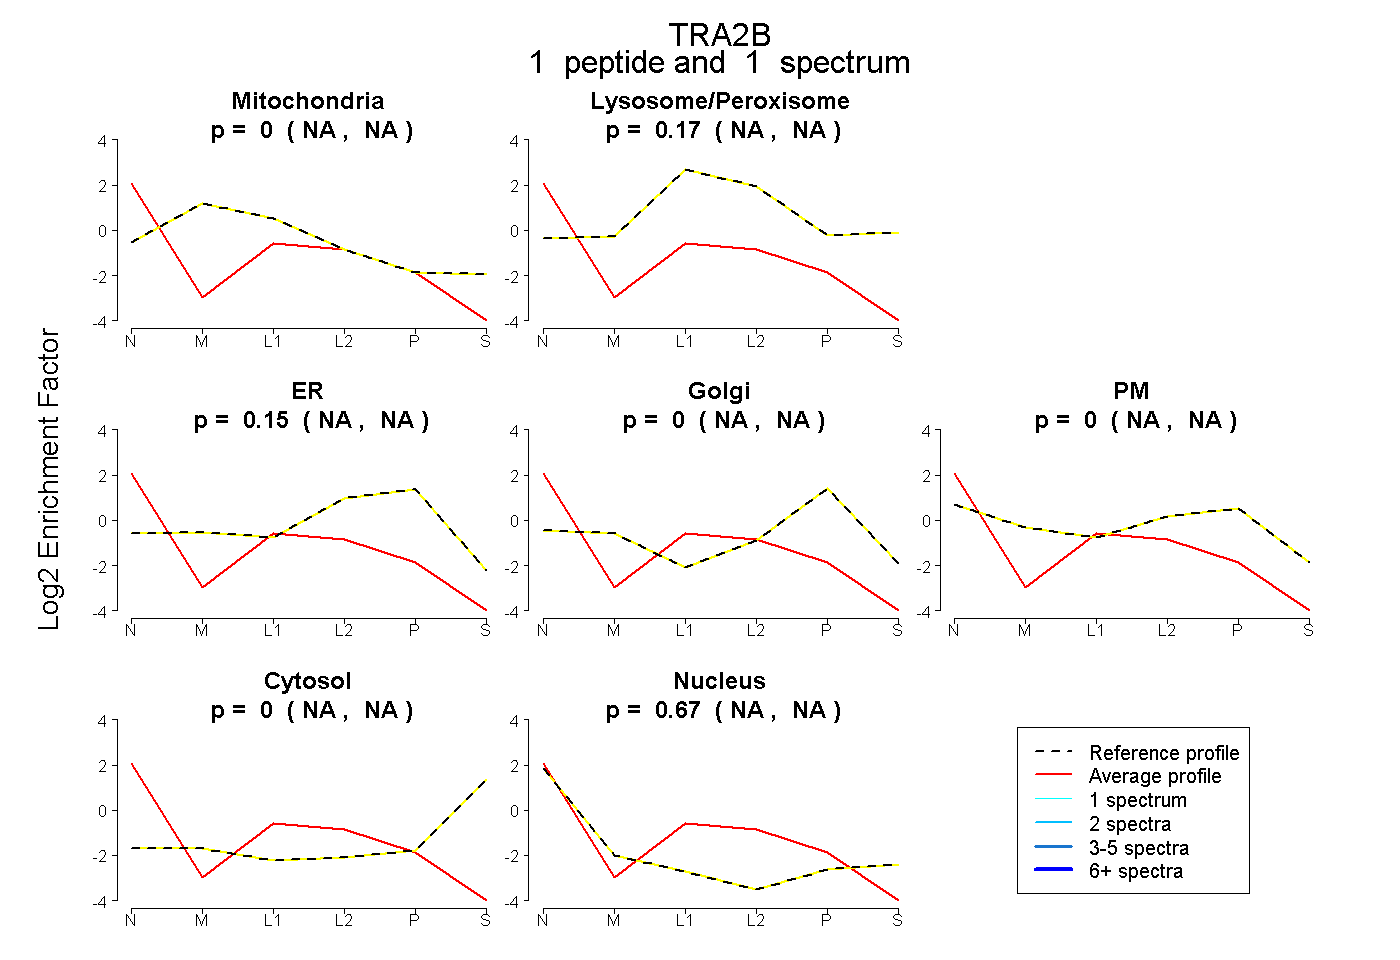 |
0.000 NA | NA |
0.175 NA | NA |
0.153 NA | NA |
0.000 NA | NA |
0.000 NA | NA |
0.000 NA | NA |
0.672 NA | NA |
|||
| Plot | Lyso | Other | |||||||||||
| Expt C |
3 peptides |
9 spectra |
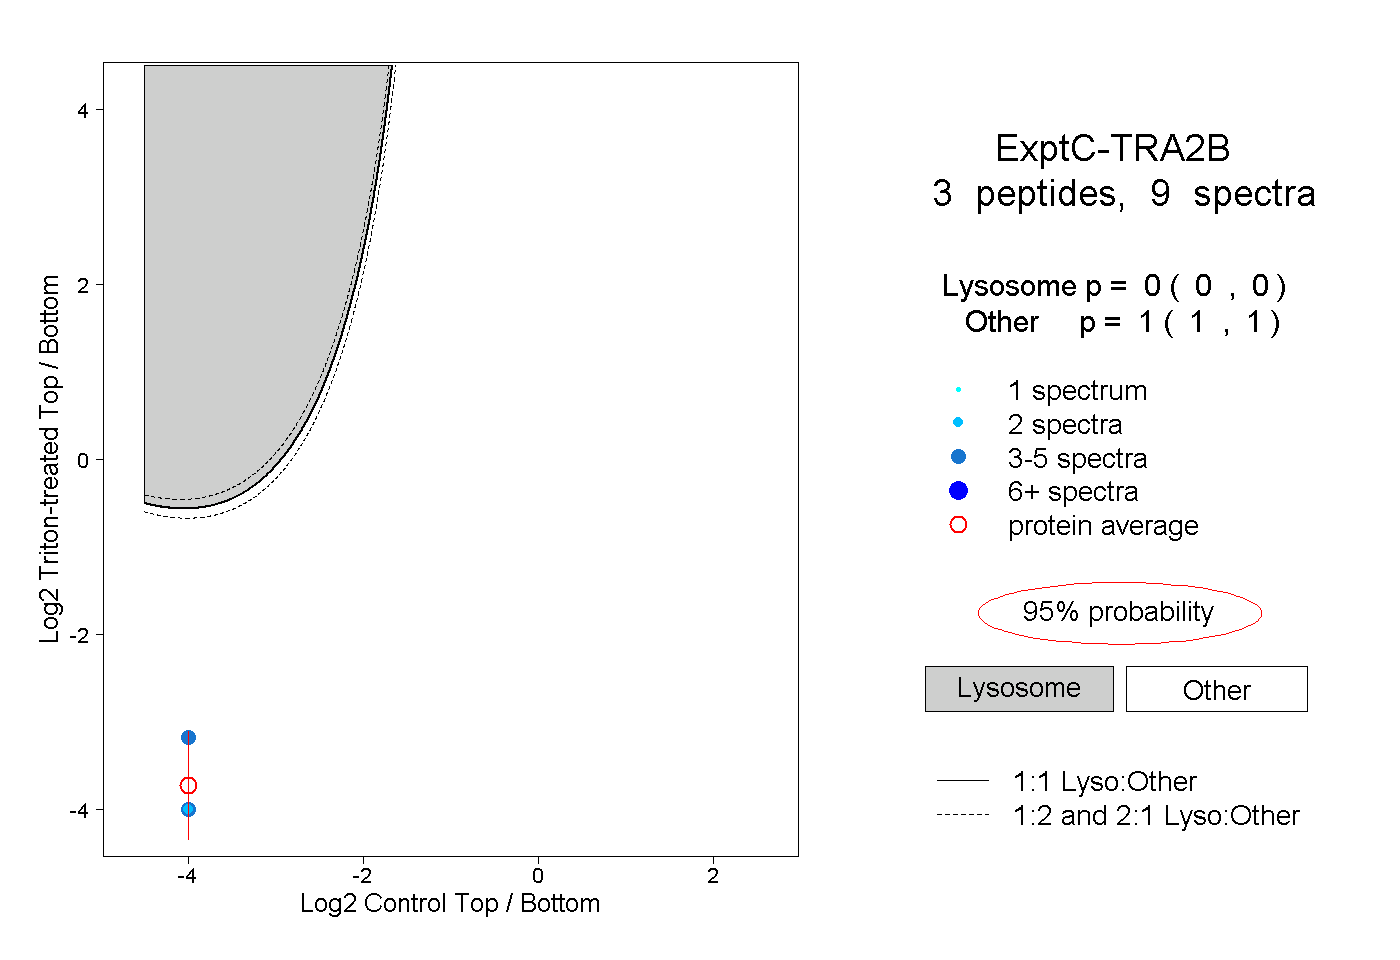 |
0.000 0.000 | 0.000 |
1.000 1.000 | 1.000 |
||||||||
| Plot | Lyso | Other | |||||||||||
| Expt D |
1 peptide |
3 spectra |
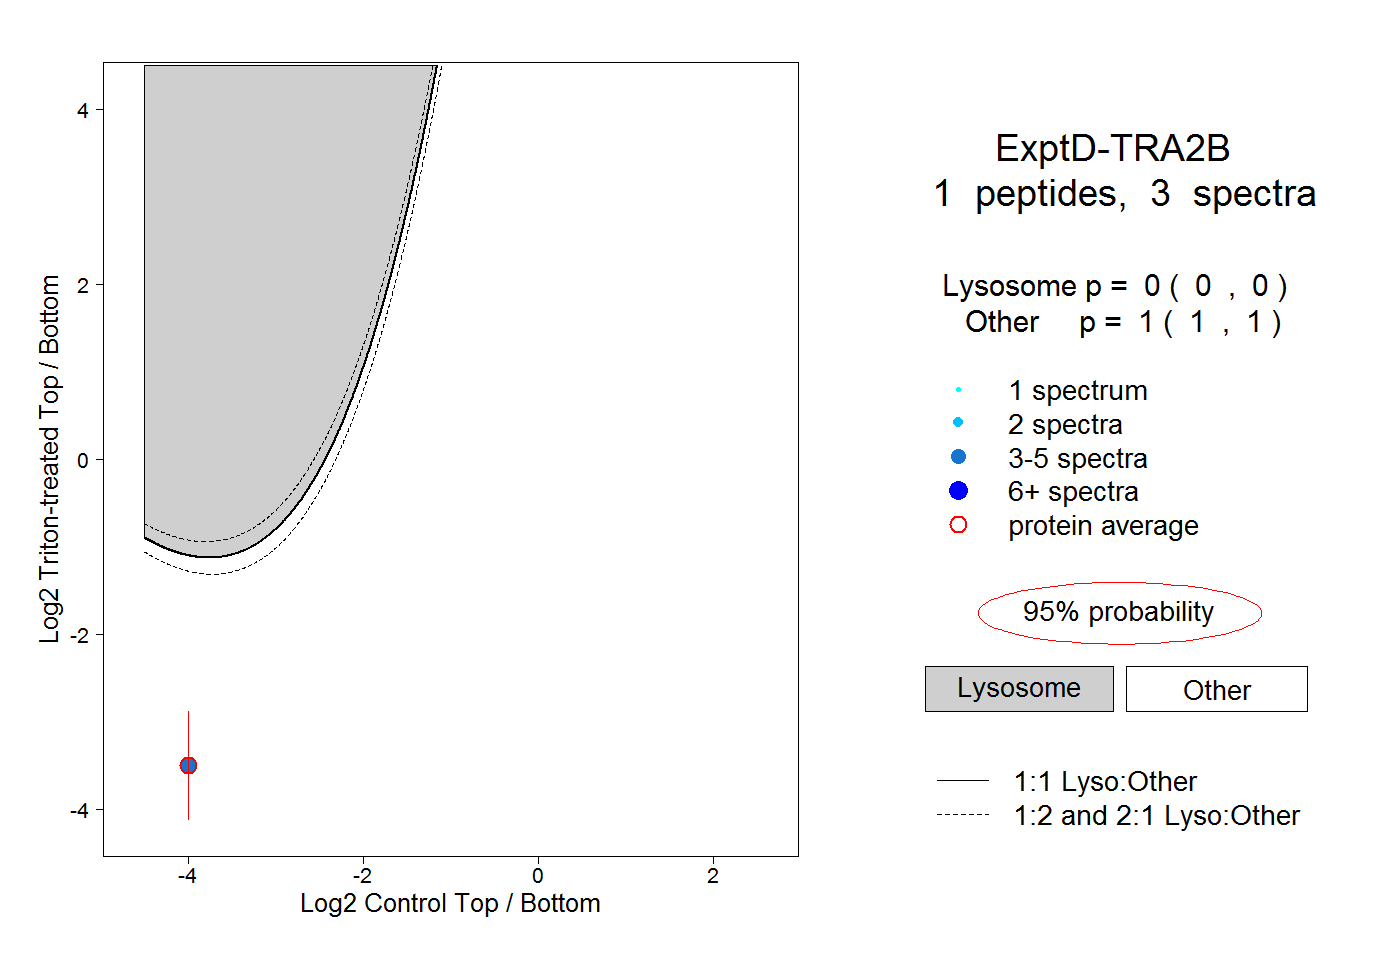 |
0.000 0.000 | 0.000 |
1.000 1.000 | 1.000 |