 38
38peptides
spectra
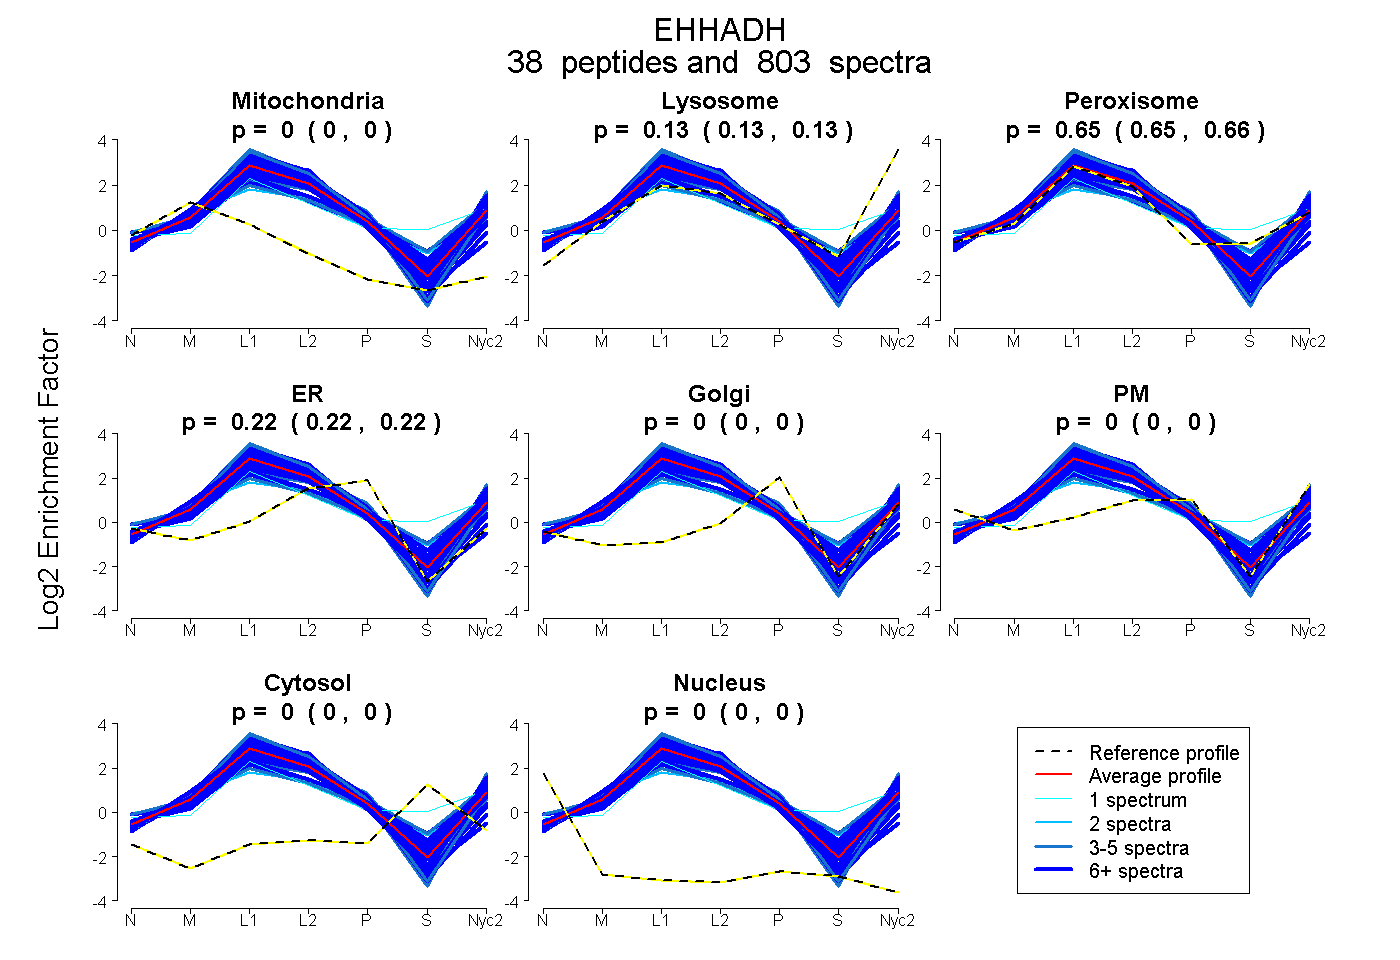
0.000 | 0.000
0.126 | 0.129
0.653 | 0.656
0.217 | 0.219
0.000 | 0.000
0.000 | 0.000
0.000 | 0.000
0.000 | 0.000
37peptides
spectra
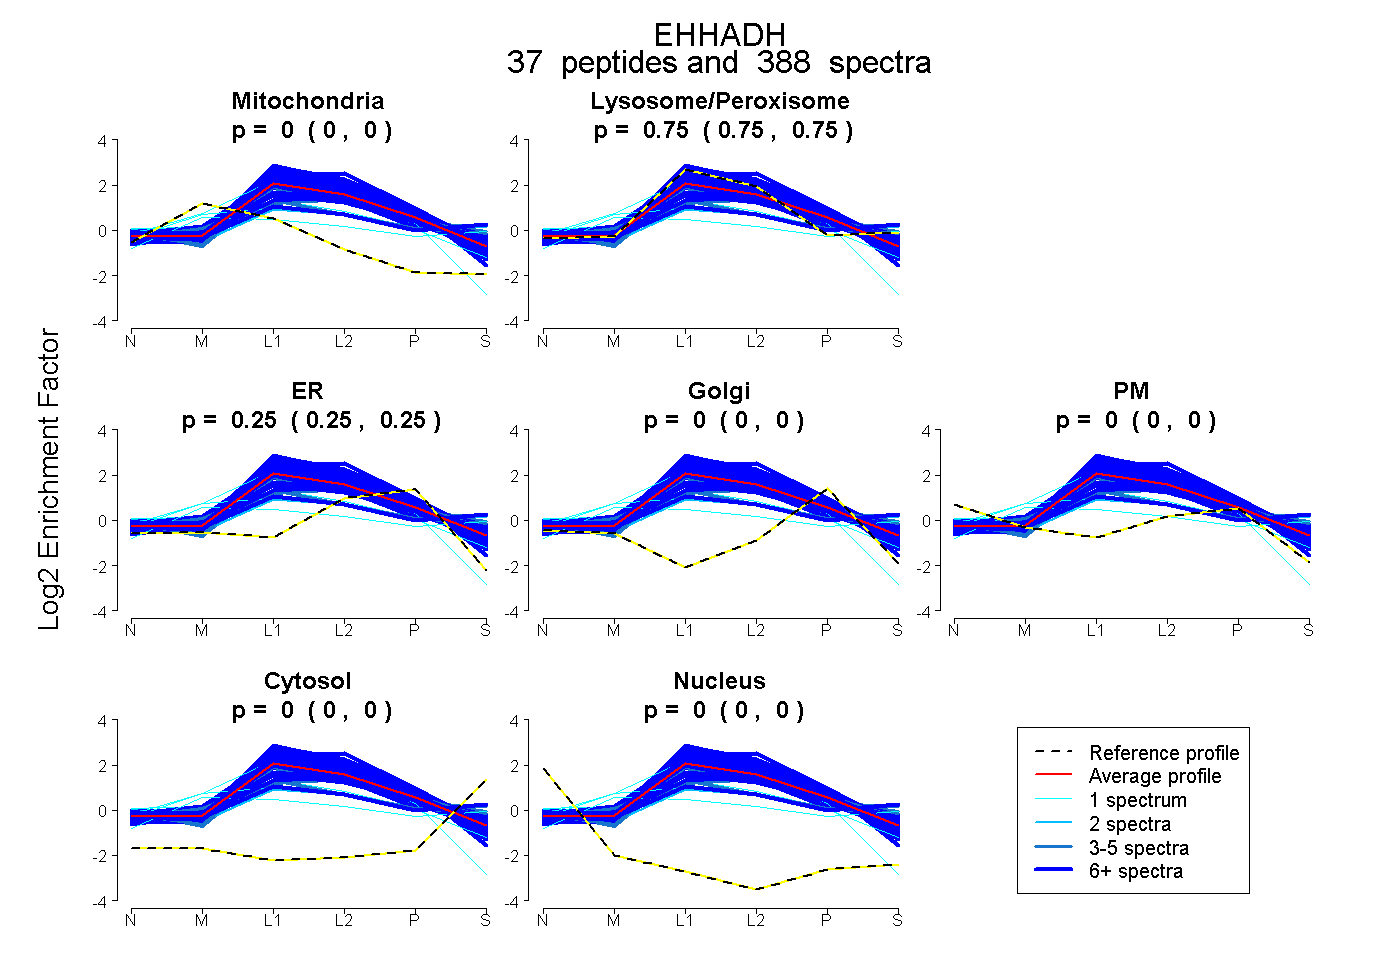
0.000 | 0.000
0.748 | 0.751
0.249 | 0.252
0.000 | 0.000
0.000 | 0.000
0.000 | 0.000
0.000 | 0.000
43peptides
spectra
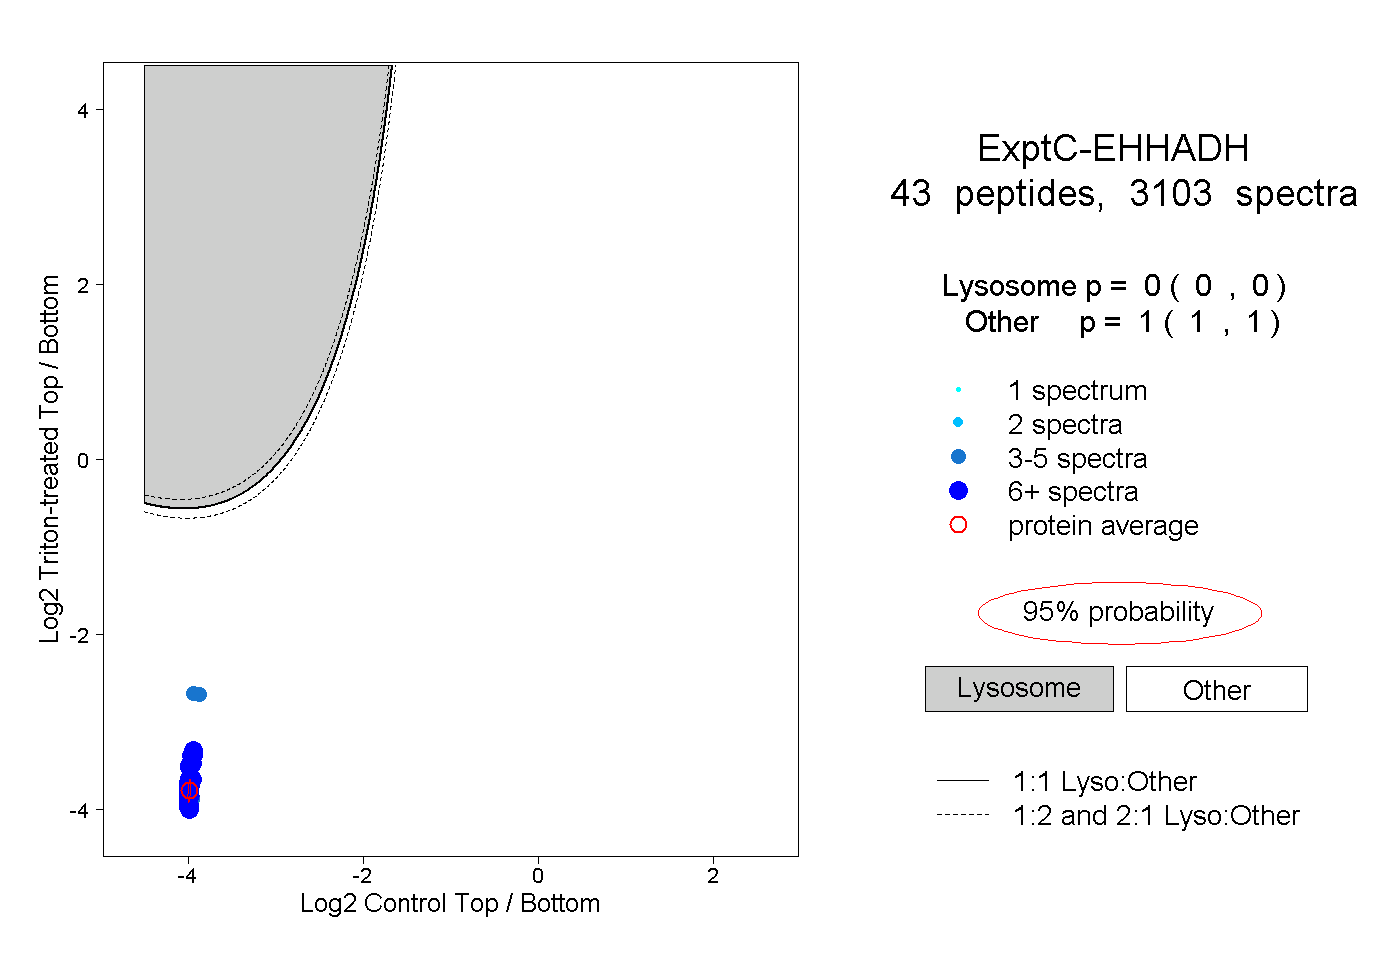
0.000 | 0.000
1.000 | 1.000
31peptides
spectra
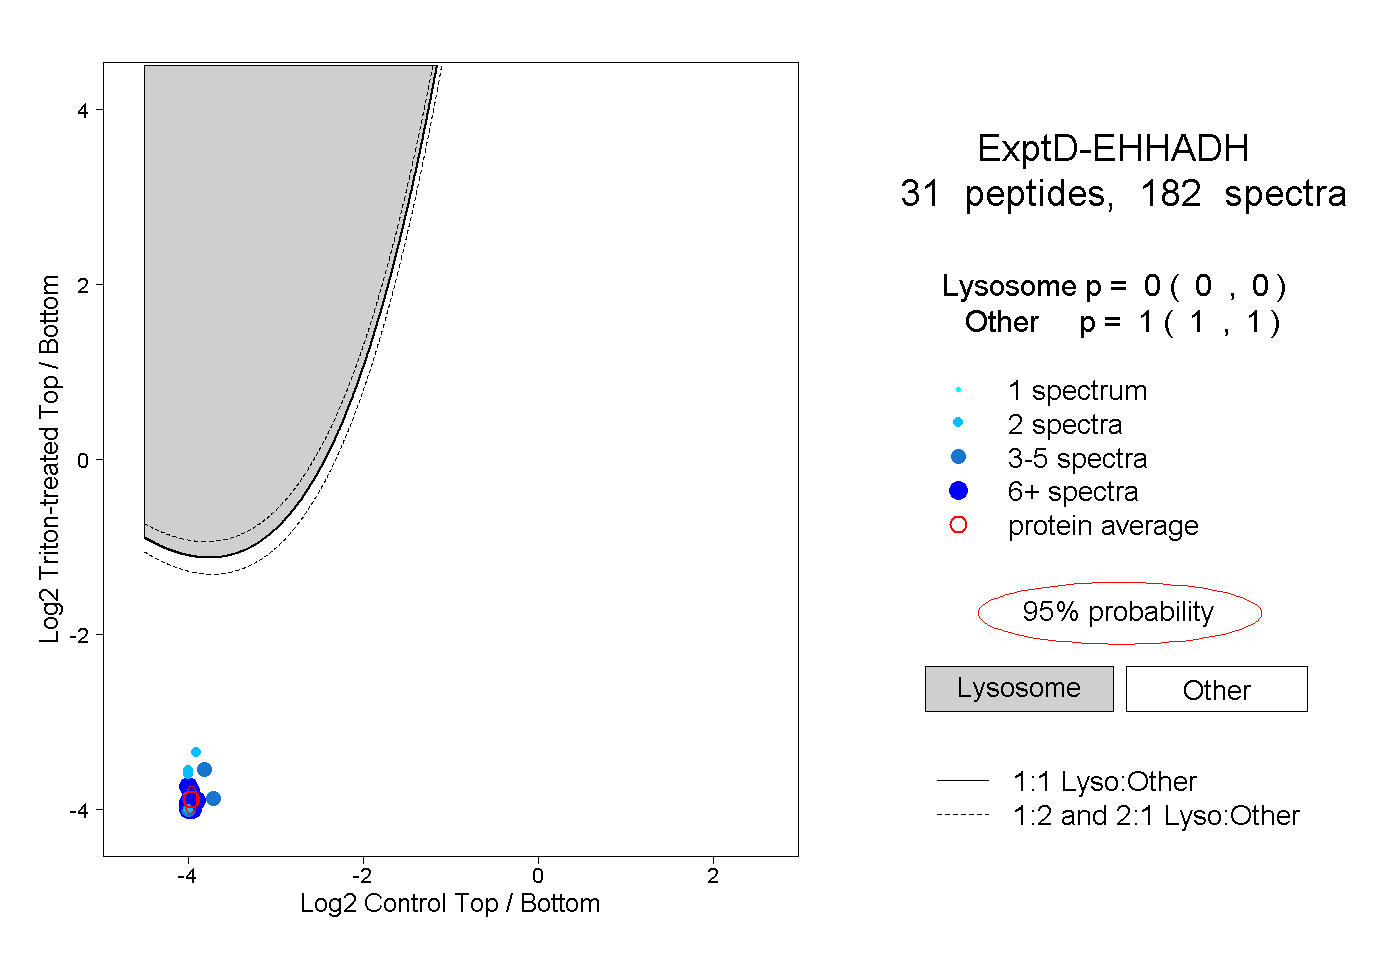
0.000 | 0.000
1.000 | 1.000