 4
4peptides
spectra
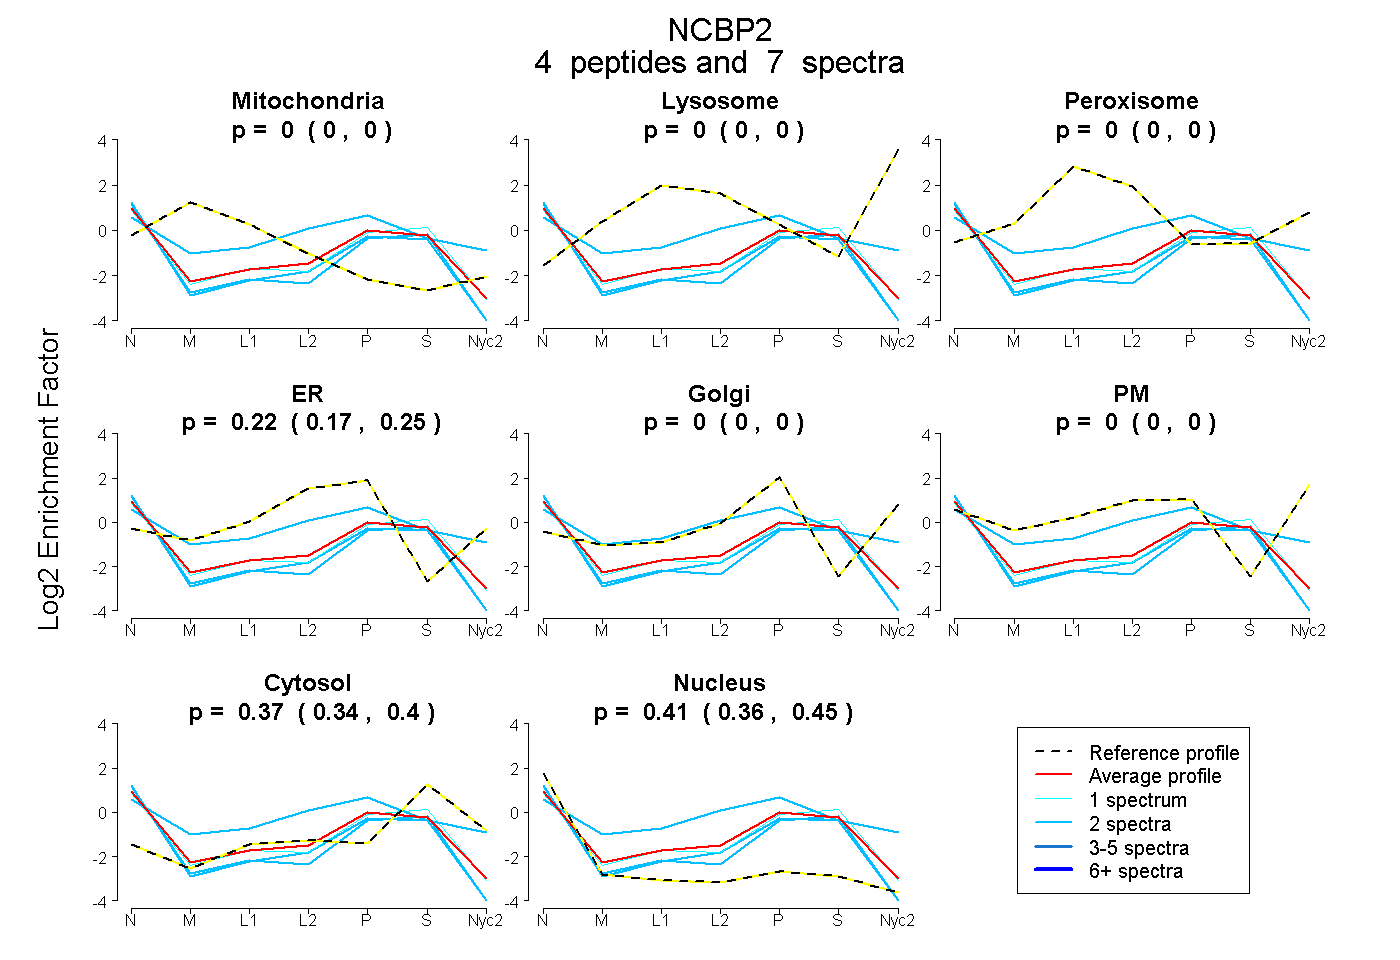
0.000 | 0.000
0.000 | 0.000
0.000 | 0.000
0.173 | 0.254
0.000 | 0.000
0.000 | 0.000
0.339 | 0.399
0.362 | 0.448
| Plot | Mito | Lyso | Perox | ER | Golgi | PM | Cytosol | Nucleus | |||||
| Expt A |
4 peptides |
7 spectra |
|
0.000 0.000 | 0.000 |
0.000 0.000 | 0.000 |
0.000 0.000 | 0.000 |
0.220 0.173 | 0.254 |
0.000 0.000 | 0.000 |
0.000 0.000 | 0.000 |
0.373 0.339 | 0.399 |
0.408 0.362 | 0.448 |
| 1 spectrum, IIMGLDK | 0.000 | 0.000 | 0.000 | 0.149 | 0.000 | 0.000 | 0.451 | 0.400 | ||
| 2 spectra, YLDGTR | 0.000 | 0.000 | 0.042 | 0.403 | 0.000 | 0.113 | 0.348 | 0.095 | ||
| 2 spectra, SDSYVELSEYR | 0.000 | 0.000 | 0.000 | 0.058 | 0.000 | 0.000 | 0.366 | 0.576 | ||
| 2 spectra, ADAENAMR | 0.000 | 0.000 | 0.000 | 0.116 | 0.000 | 0.000 | 0.318 | 0.567 |
| Plot | Lyso | Other | |||||||||||
| Expt C |
1 peptide |
1 spectrum |
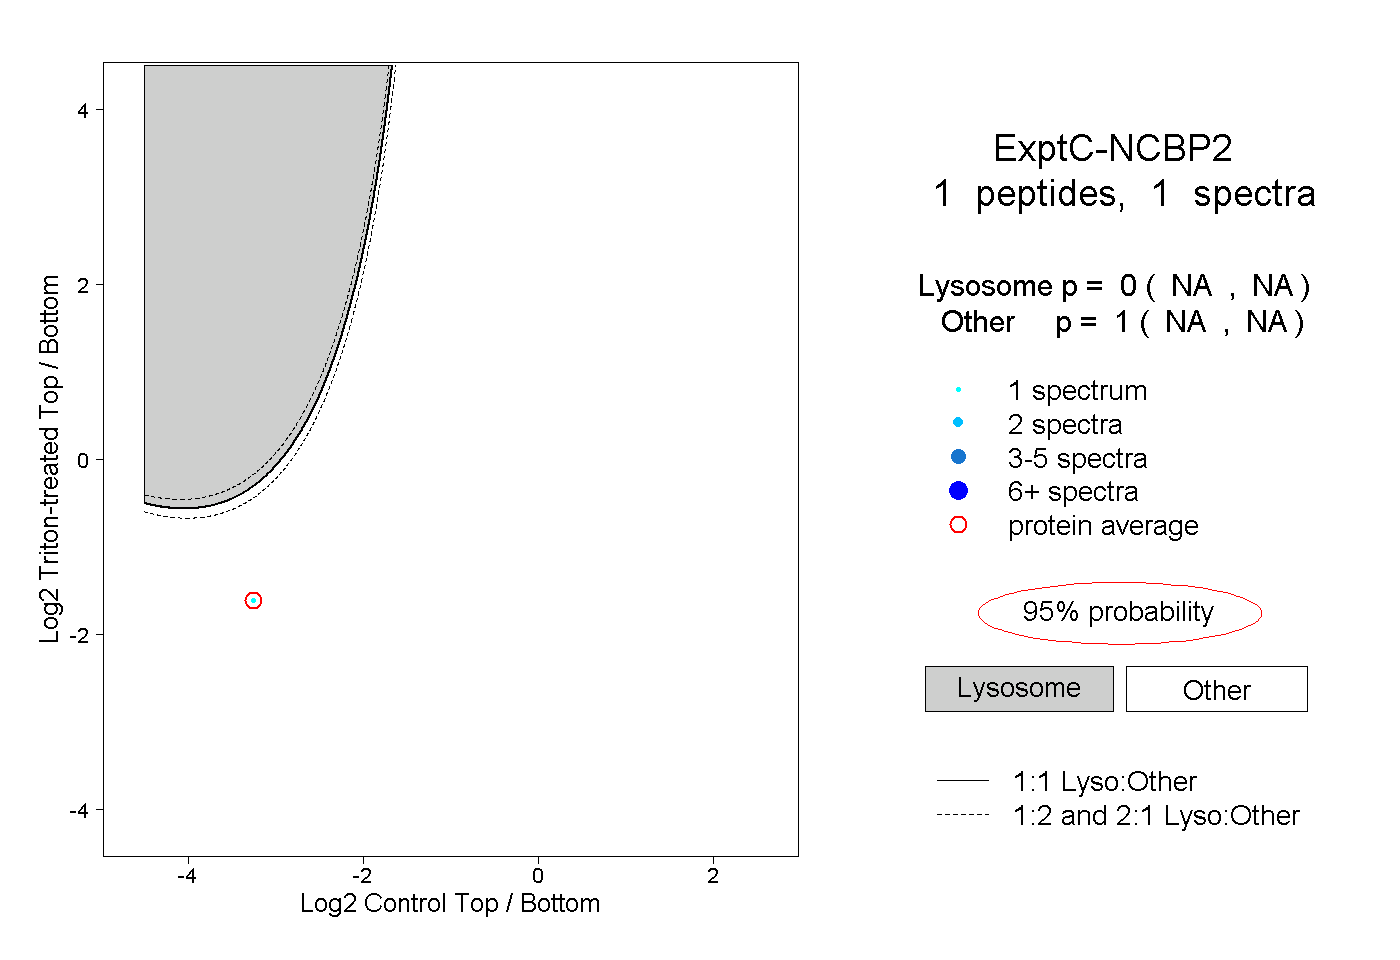 |
0.000 NA | NA |
1.000 NA | NA |