17
17peptides
spectra
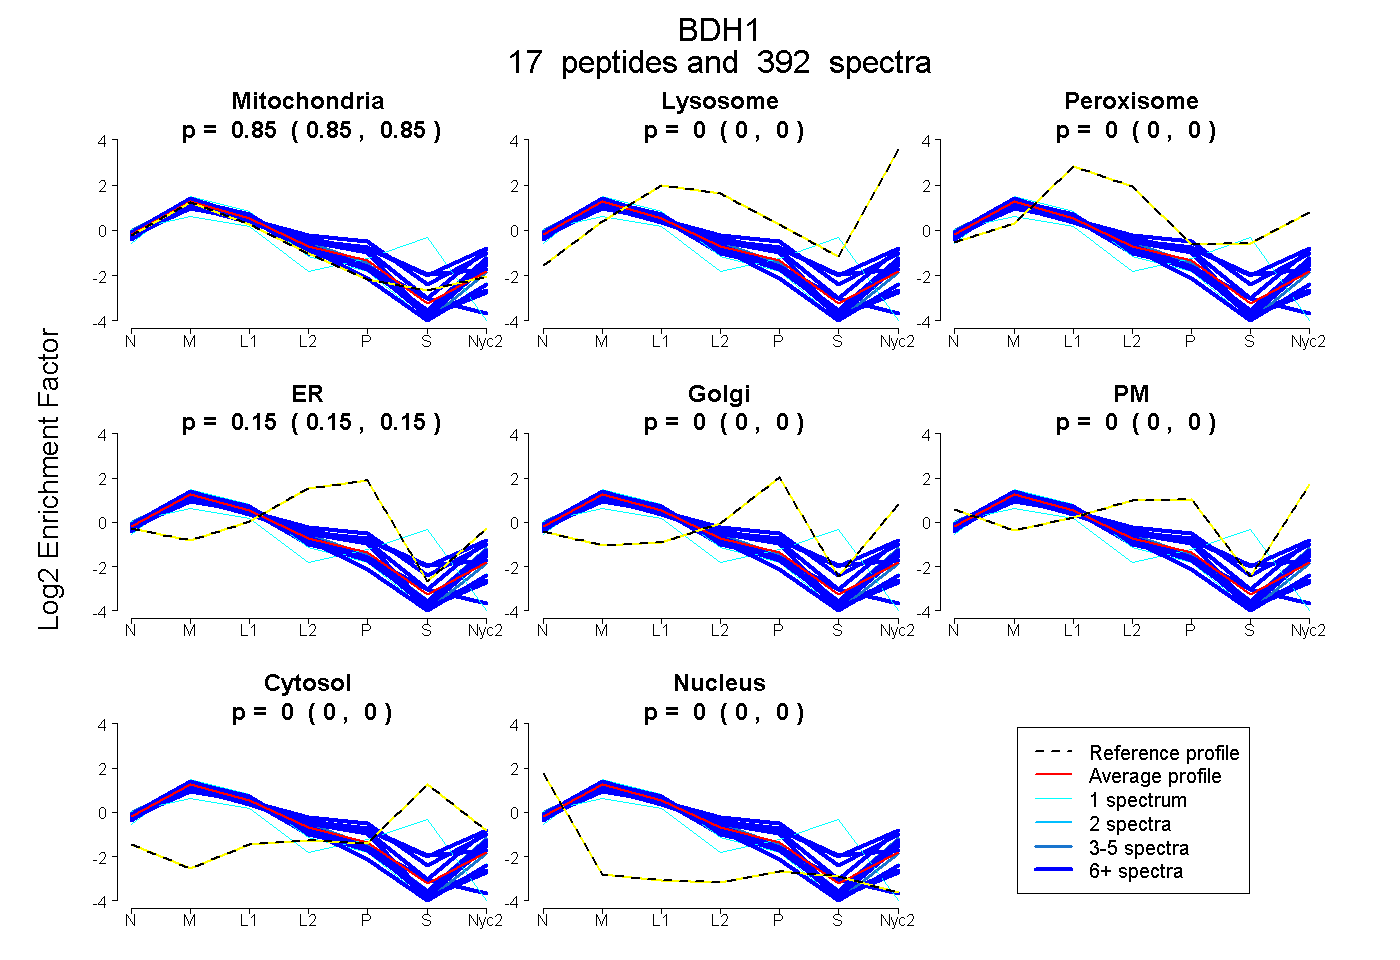
0.849 | 0.853
0.000 | 0.000
0.000 | 0.000
0.147 | 0.150
0.000 | 0.000
0.000 | 0.000
0.000 | 0.000
0.000 | 0.000
17peptides
spectra
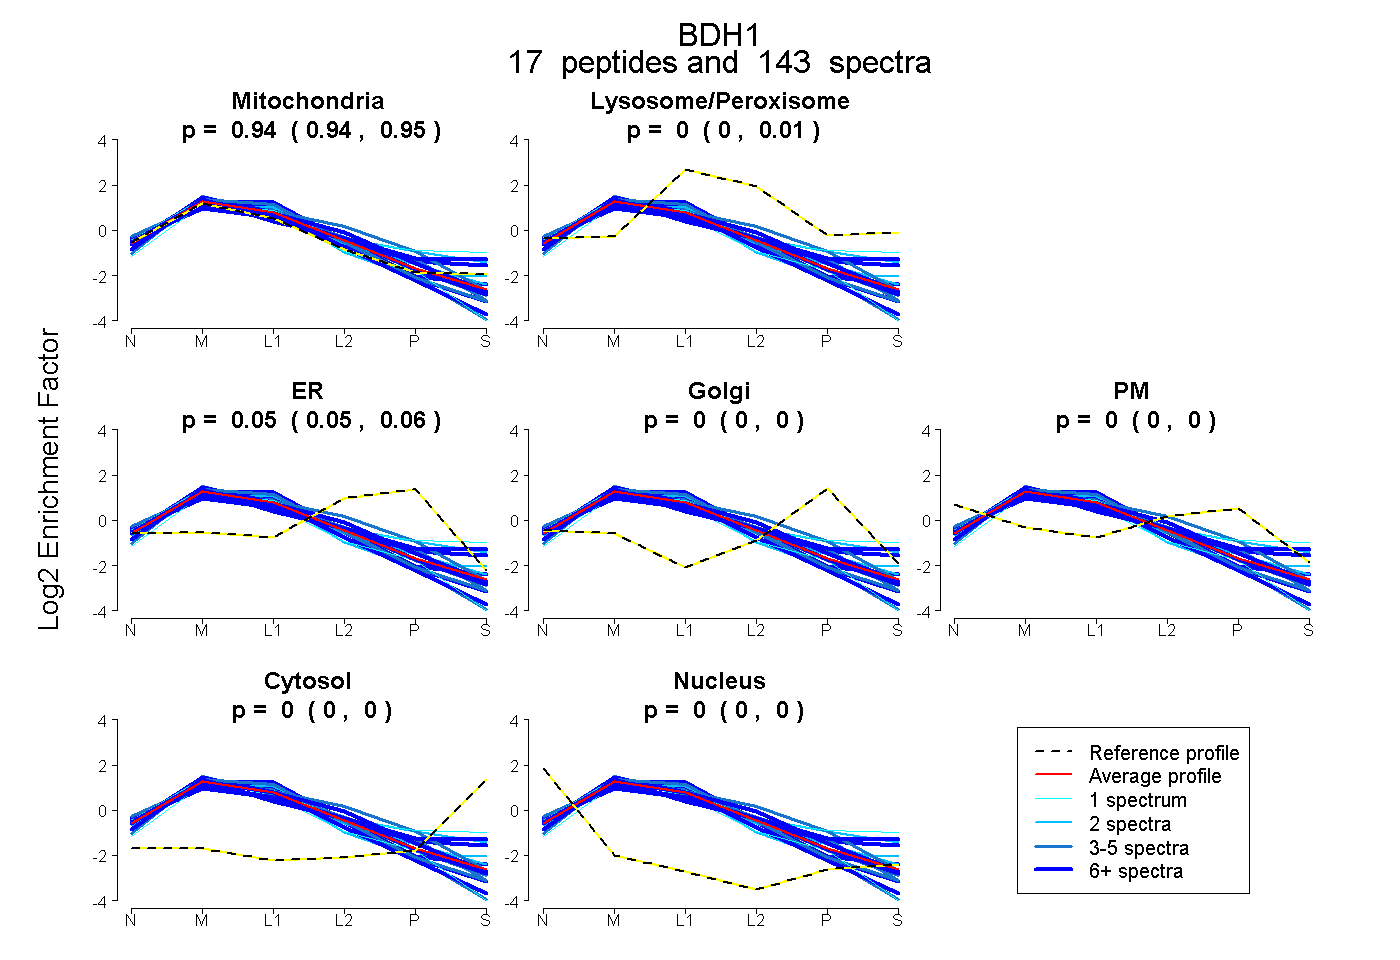
0.941 | 0.948
0.000 | 0.006
0.049 | 0.056
0.000 | 0.000
0.000 | 0.000
0.000 | 0.000
0.000 | 0.000
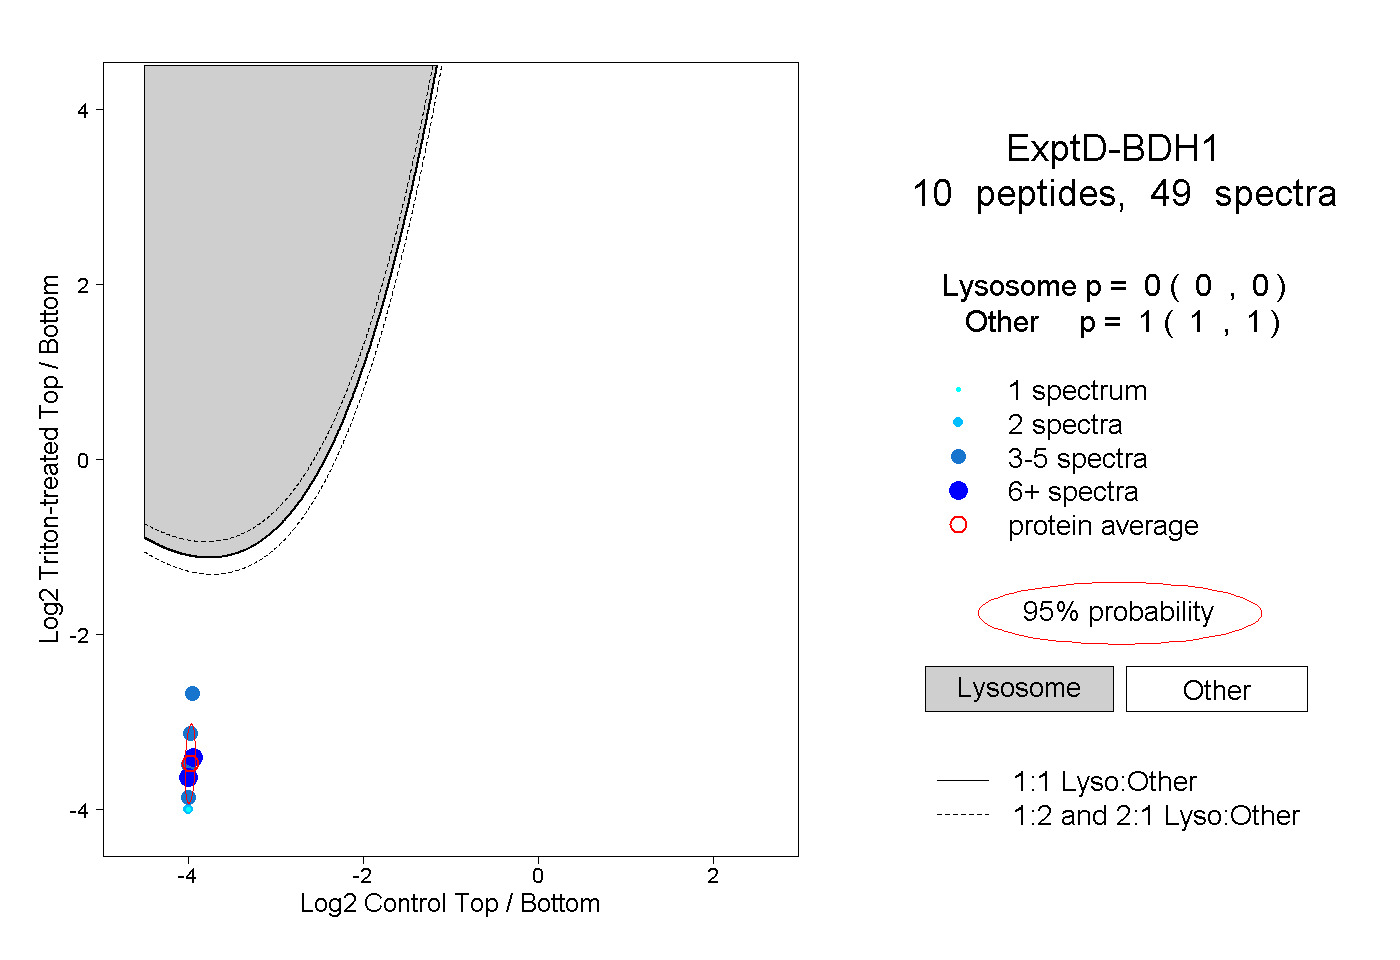
17peptides
spectra
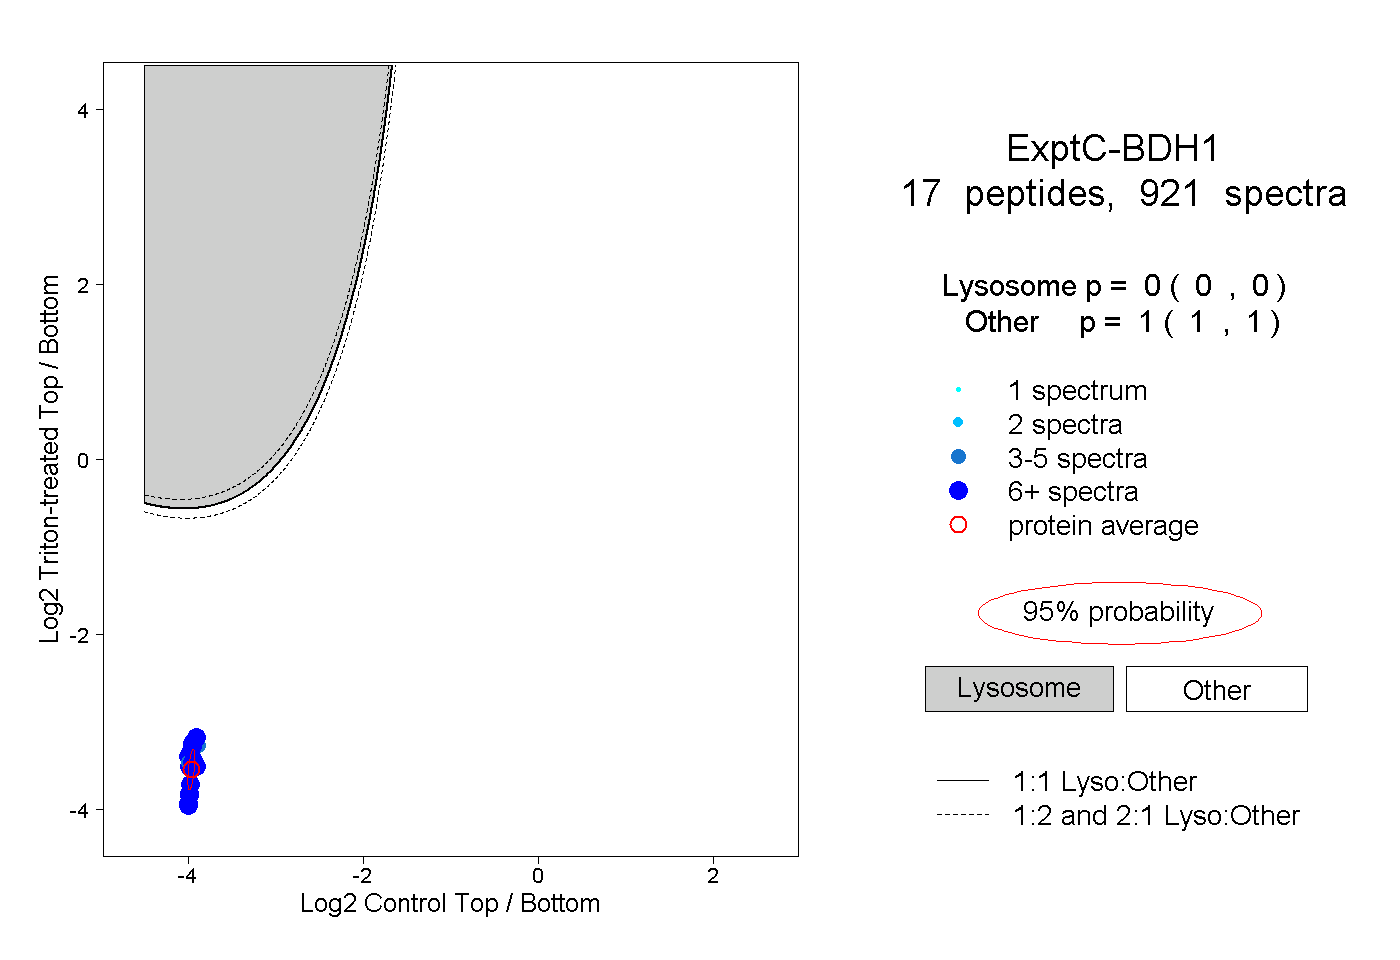
0.000 | 0.000
1.000 | 1.000