 4
4peptides
spectra
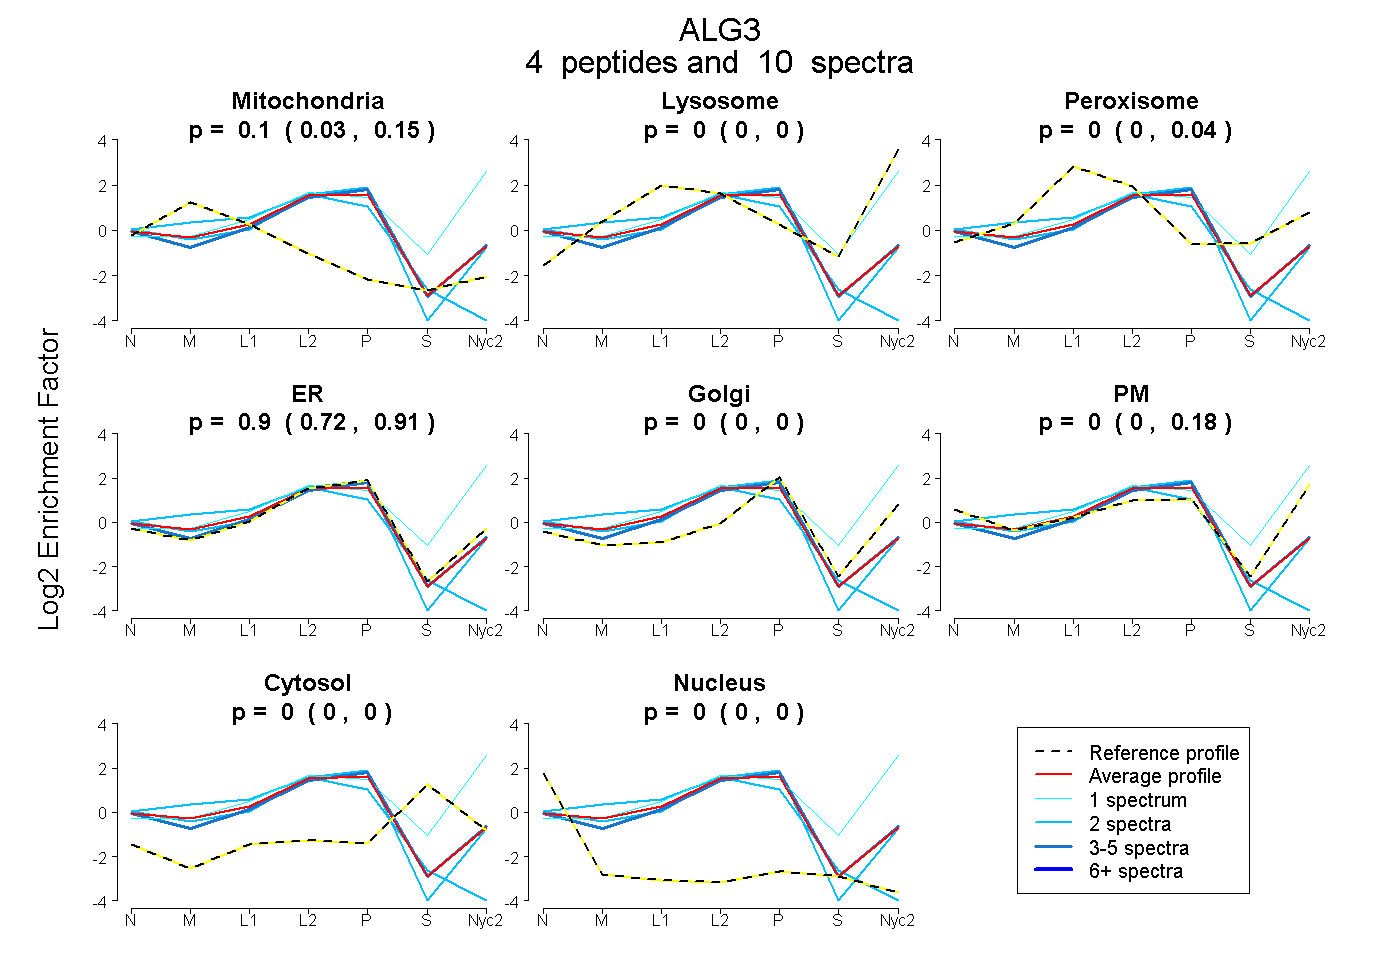
0.028 | 0.148
0.000 | 0.000
0.000 | 0.036
0.719 | 0.909
0.000 | 0.000
0.000 | 0.182
0.000 | 0.000
0.000 | 0.000
3peptides
spectra
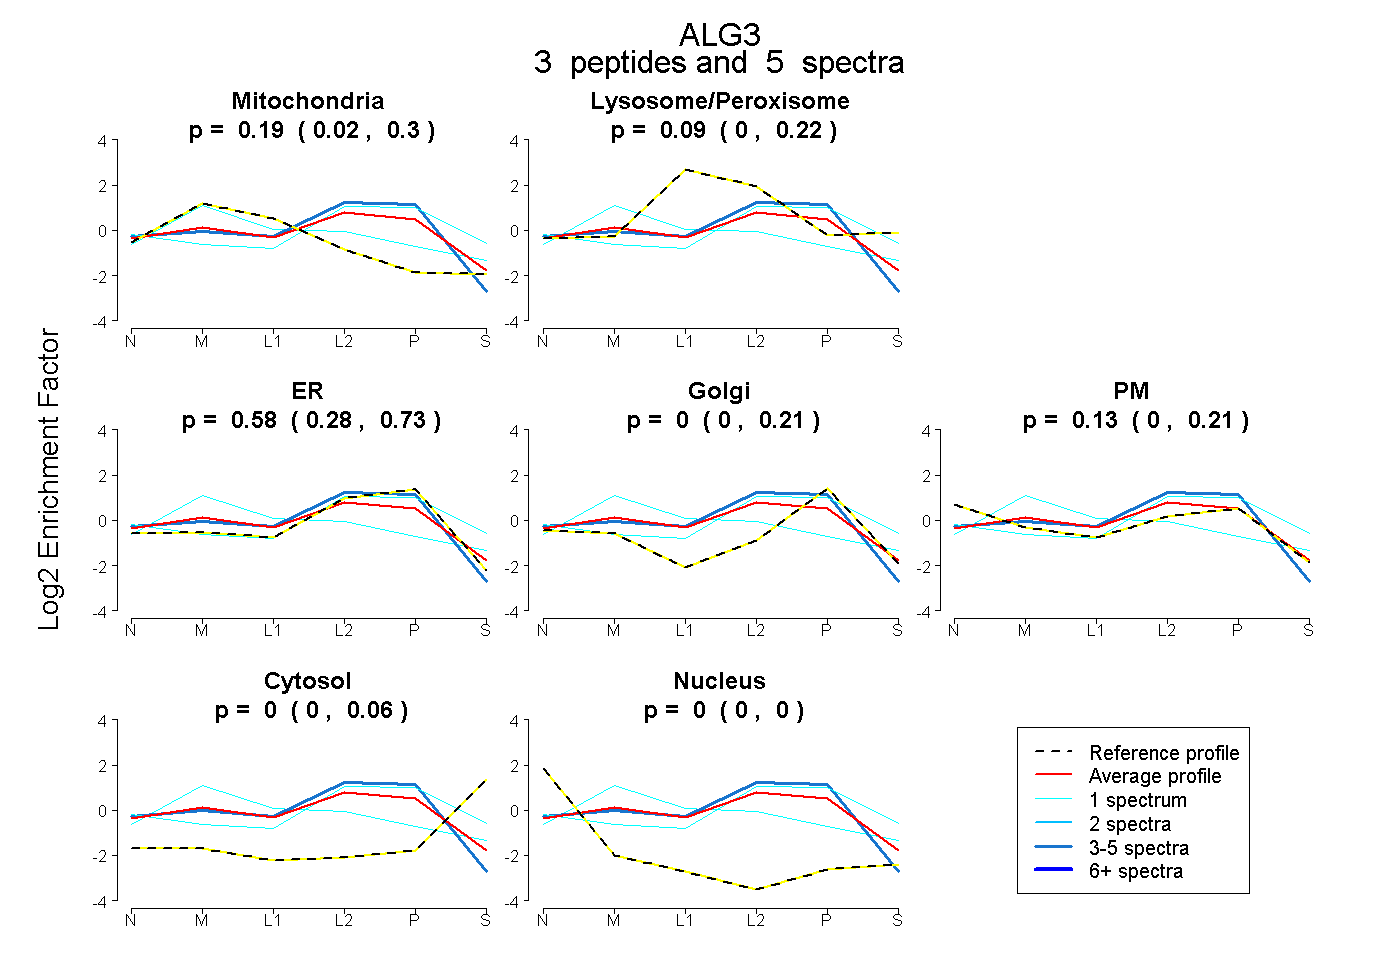
0.023 | 0.298
0.002 | 0.219
0.281 | 0.725
0.000 | 0.208
0.000 | 0.211
0.000 | 0.060
0.000 | 0.000
3peptides
spectra
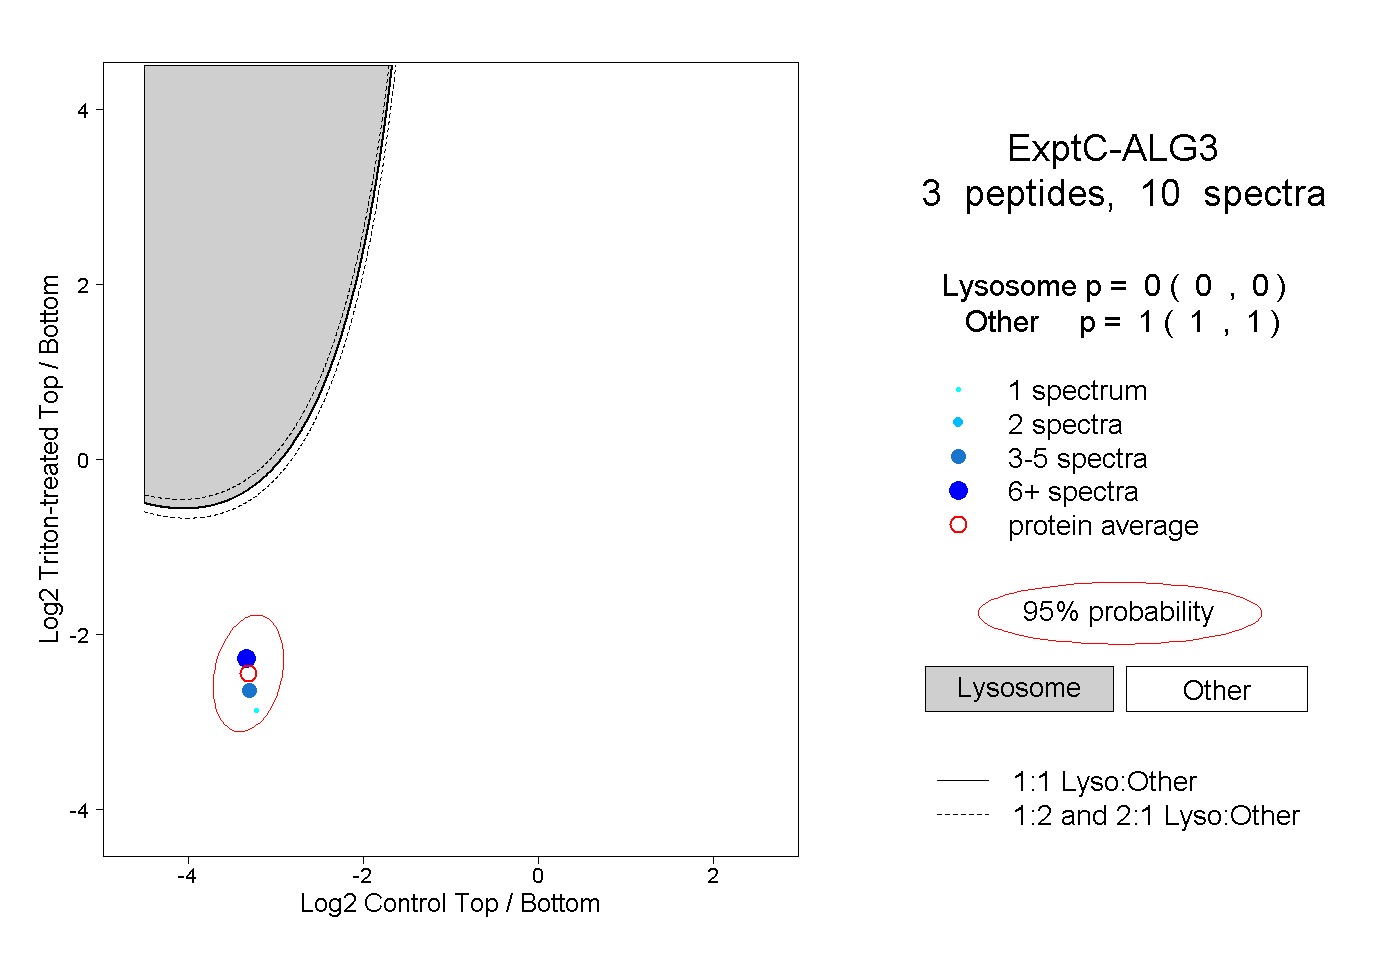
0.000 | 0.000
1.000 | 1.000