 10
10peptides
spectra
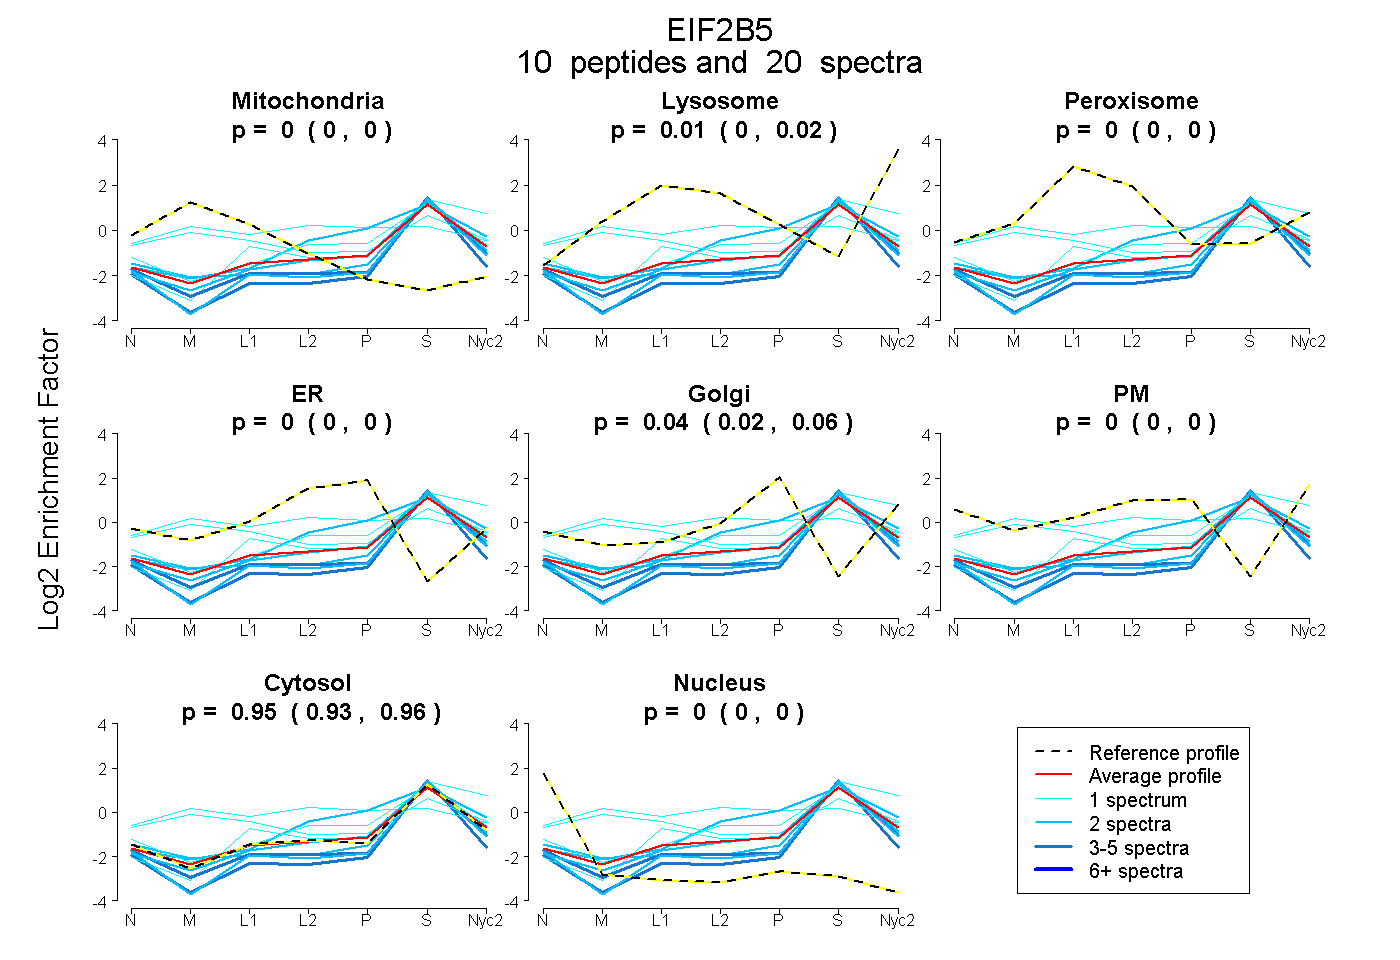
0.000 | 0.004
0.000 | 0.022
0.000 | 0.000
0.000 | 0.000
0.021 | 0.058
0.000 | 0.000
0.934 | 0.964
0.000 | 0.000
1peptide
spectra
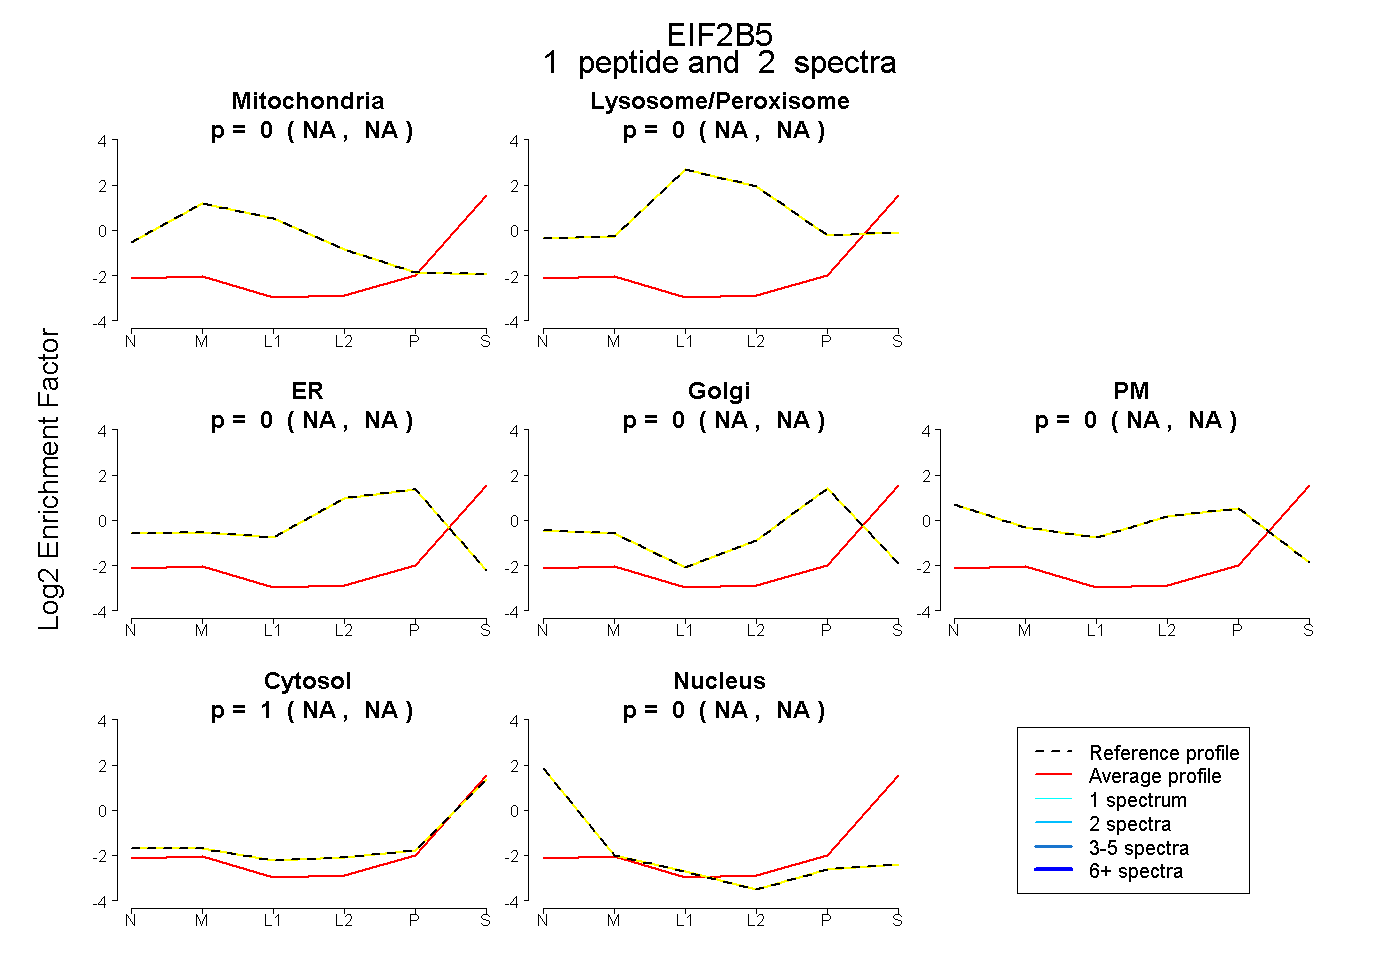
NA | NA
NA | NA
NA | NA
NA | NA
NA | NA
NA | NA
NA | NA
5peptides
spectra
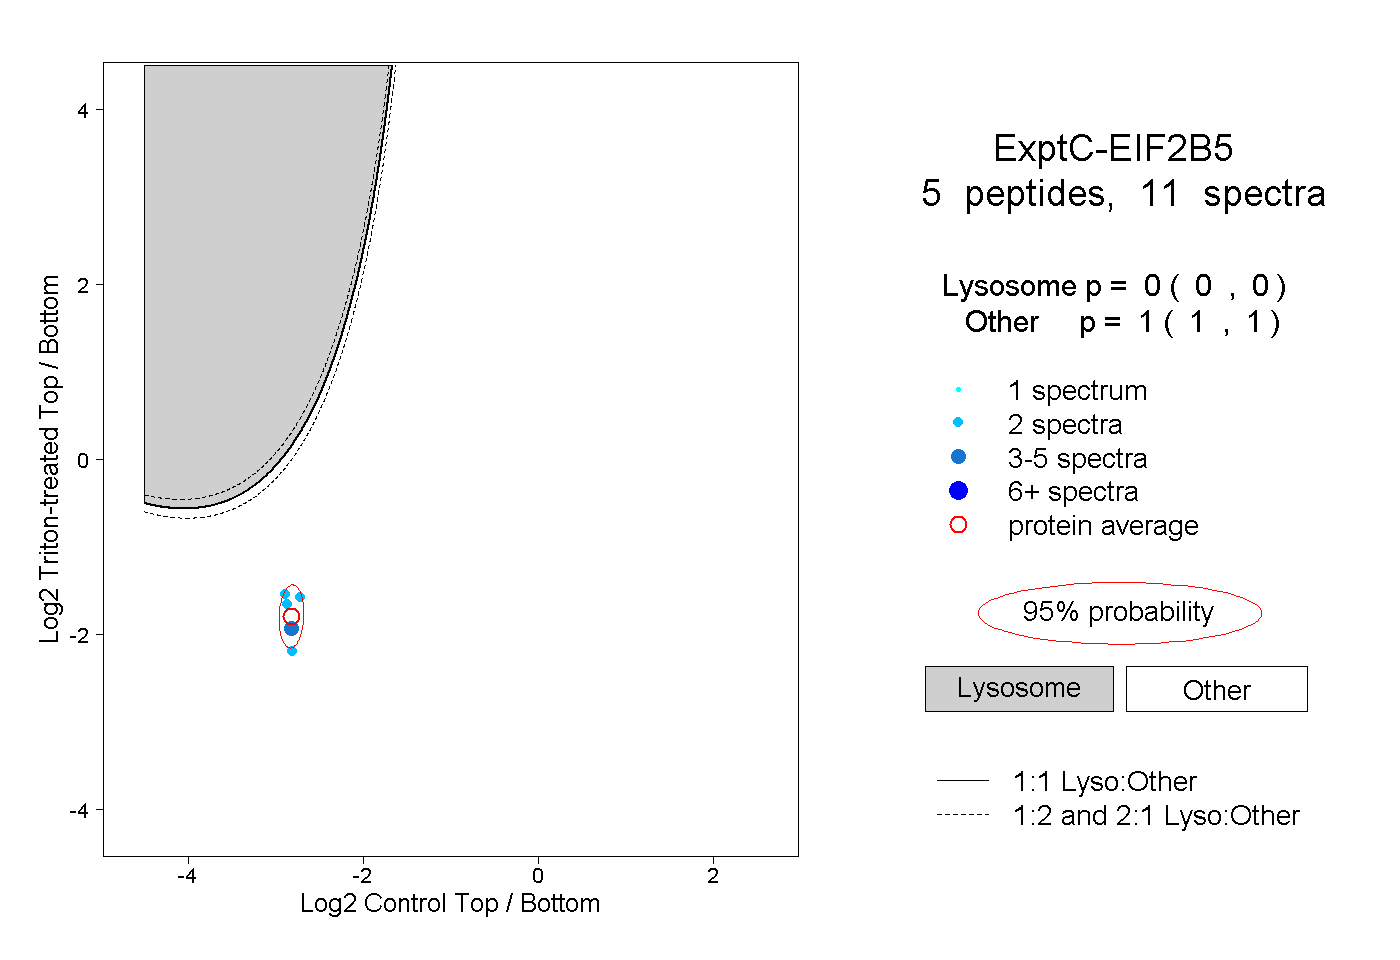
0.000 | 0.000
1.000 | 1.000