 2
2peptides
spectra
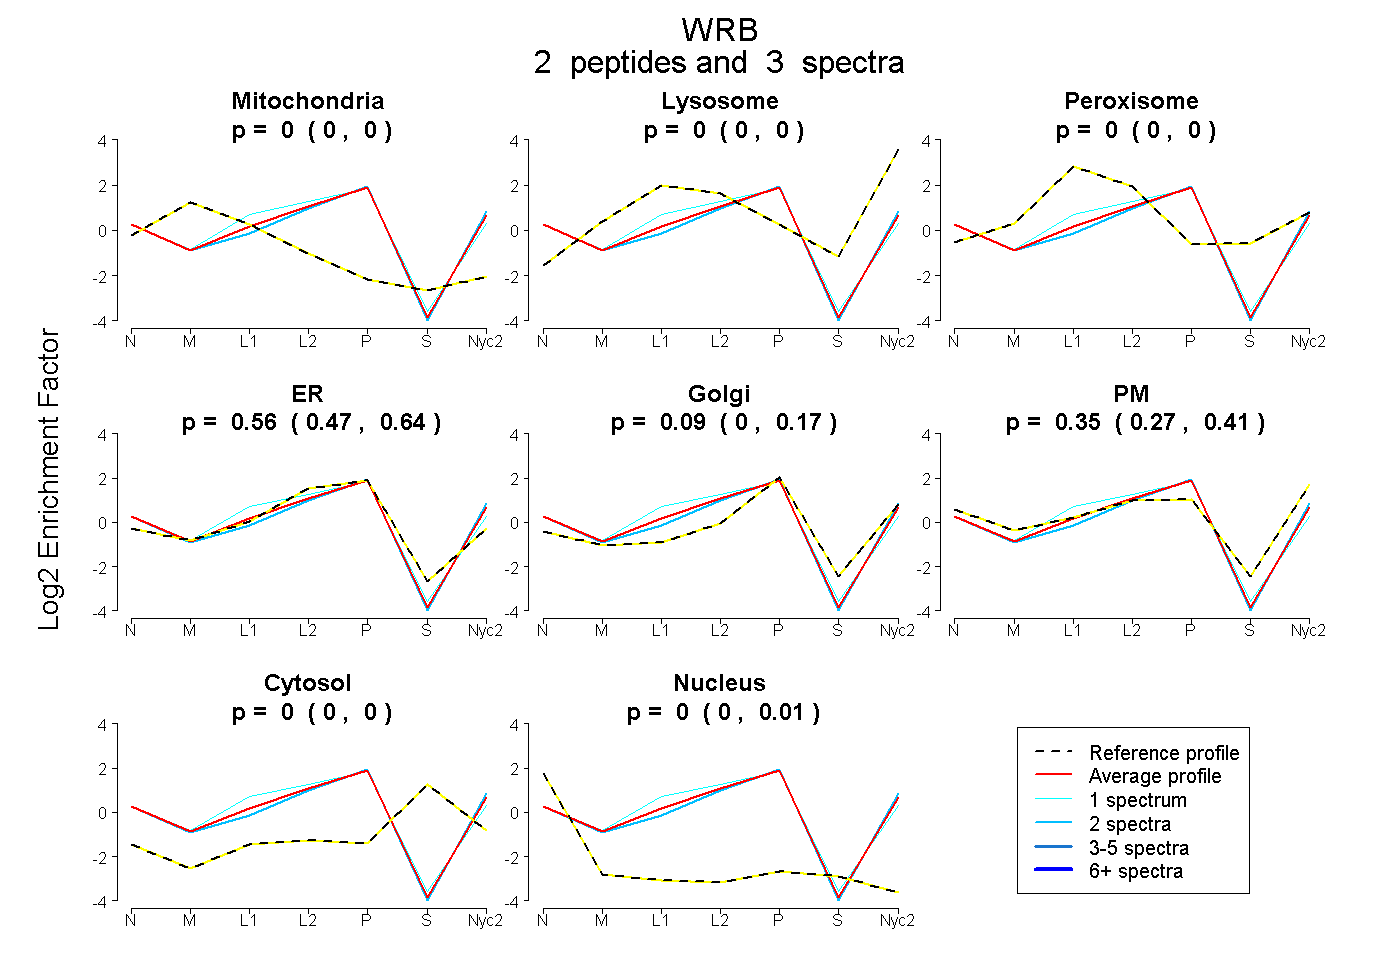
0.000 | 0.000
0.000 | 0.000
0.000 | 0.000
0.467 | 0.642
0.000 | 0.167
0.273 | 0.415
0.000 | 0.000
0.000 | 0.007
| Plot | Mito | Lyso | Perox | ER | Golgi | PM | Cytosol | Nucleus | |||||
| Expt A |
2 peptides |
3 spectra |
|
0.000 0.000 | 0.000 |
0.000 0.000 | 0.000 |
0.000 0.000 | 0.000 |
0.562 0.467 | 0.642 |
0.088 0.000 | 0.167 |
0.350 0.273 | 0.415 |
0.000 0.000 | 0.000 |
0.000 0.000 | 0.007 |
| 2 spectra, LVAFPTR | 0.000 | 0.000 | 0.000 | 0.439 | 0.214 | 0.347 | 0.000 | 0.000 | ||
| 1 spectrum, WITPLDR | 0.000 | 0.000 | 0.000 | 0.717 | 0.000 | 0.283 | 0.000 | 0.000 |
| Plot | Mito | Lyso or Perox | ER | Golgi | PM | Cytosol | Nucleus | ||||||
| Expt B |
1 peptide |
1 spectrum |
 |
0.000 NA | NA |
0.000 NA | NA |
0.695 NA | NA |
0.289 NA | NA |
0.000 NA | NA |
0.000 NA | NA |
0.016 NA | NA |
|||
| Plot | Lyso | Other | |||||||||||
| Expt C |
1 peptide |
2 spectra |
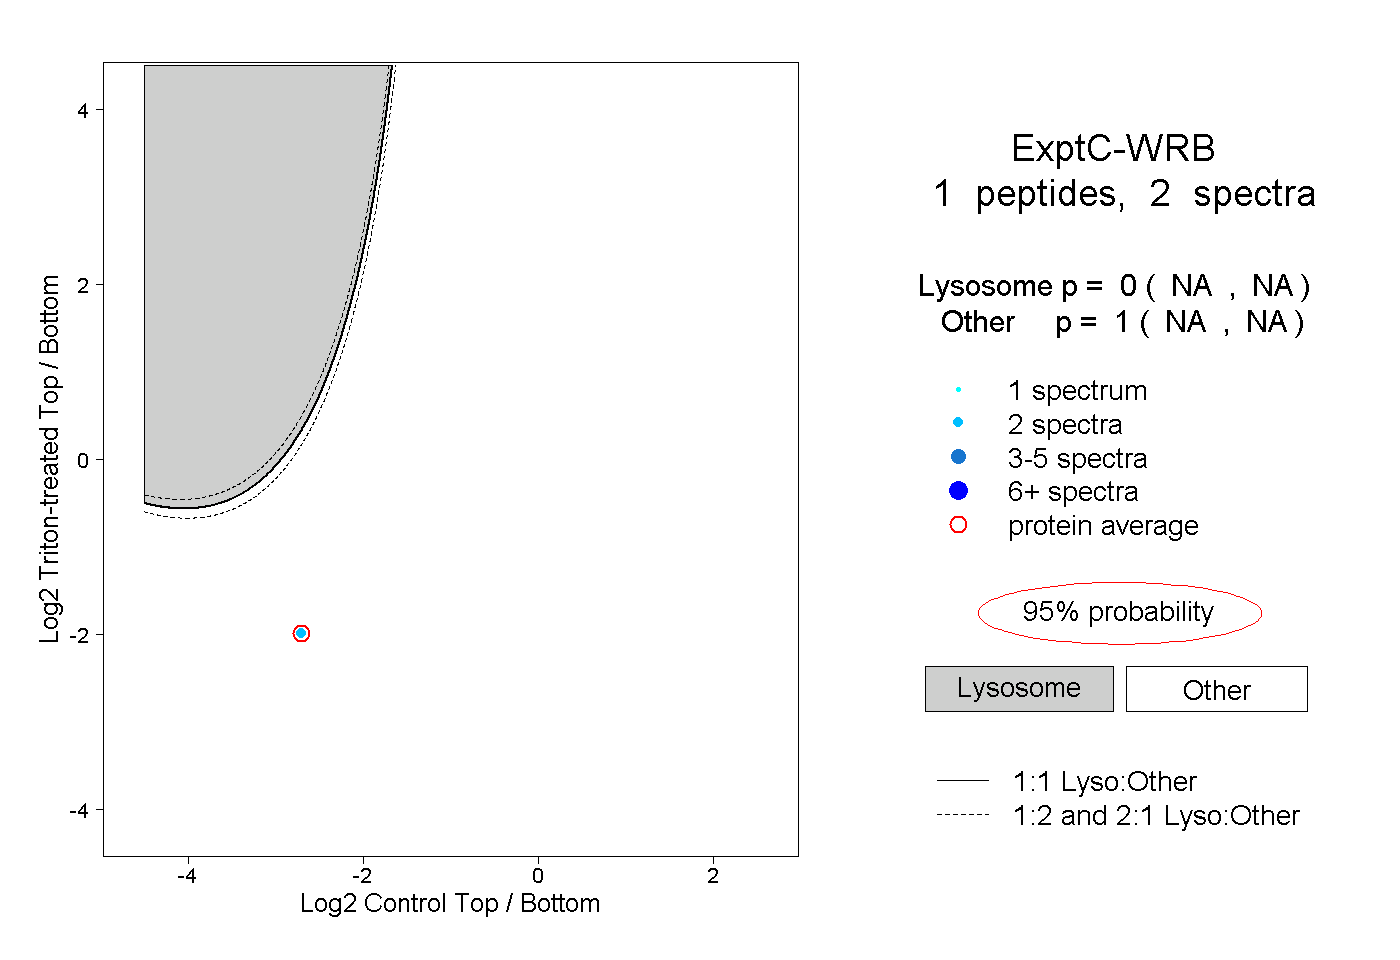 |
0.000 NA | NA |
1.000 NA | NA |