 3
3peptides
spectra
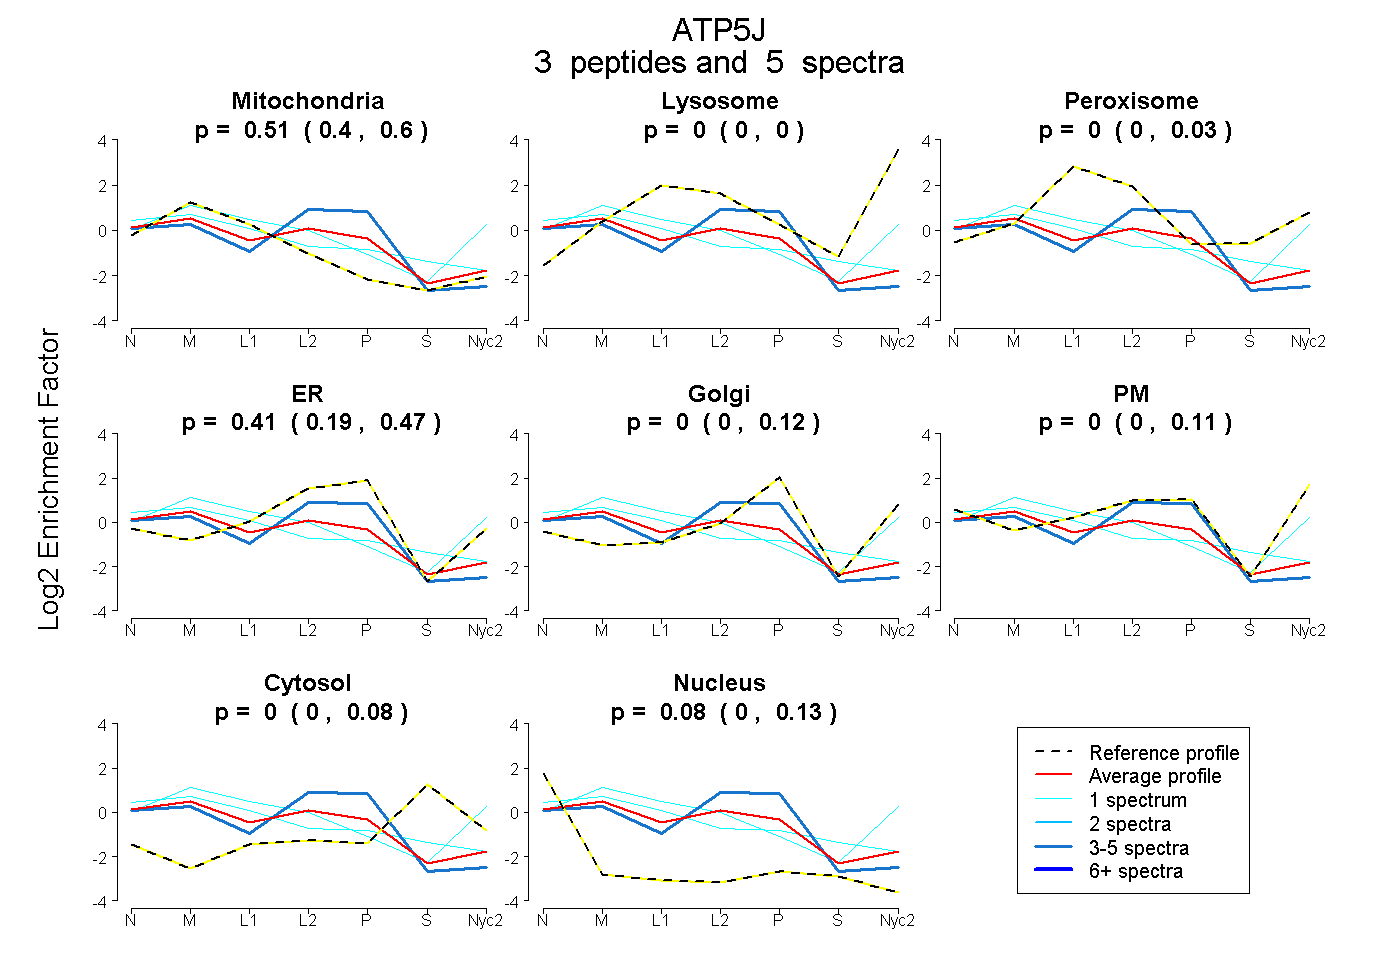
0.400 | 0.597
0.000 | 0.000
0.000 | 0.031
0.191 | 0.471
0.000 | 0.116
0.000 | 0.114
0.000 | 0.082
0.000 | 0.132
1peptide
spectrum
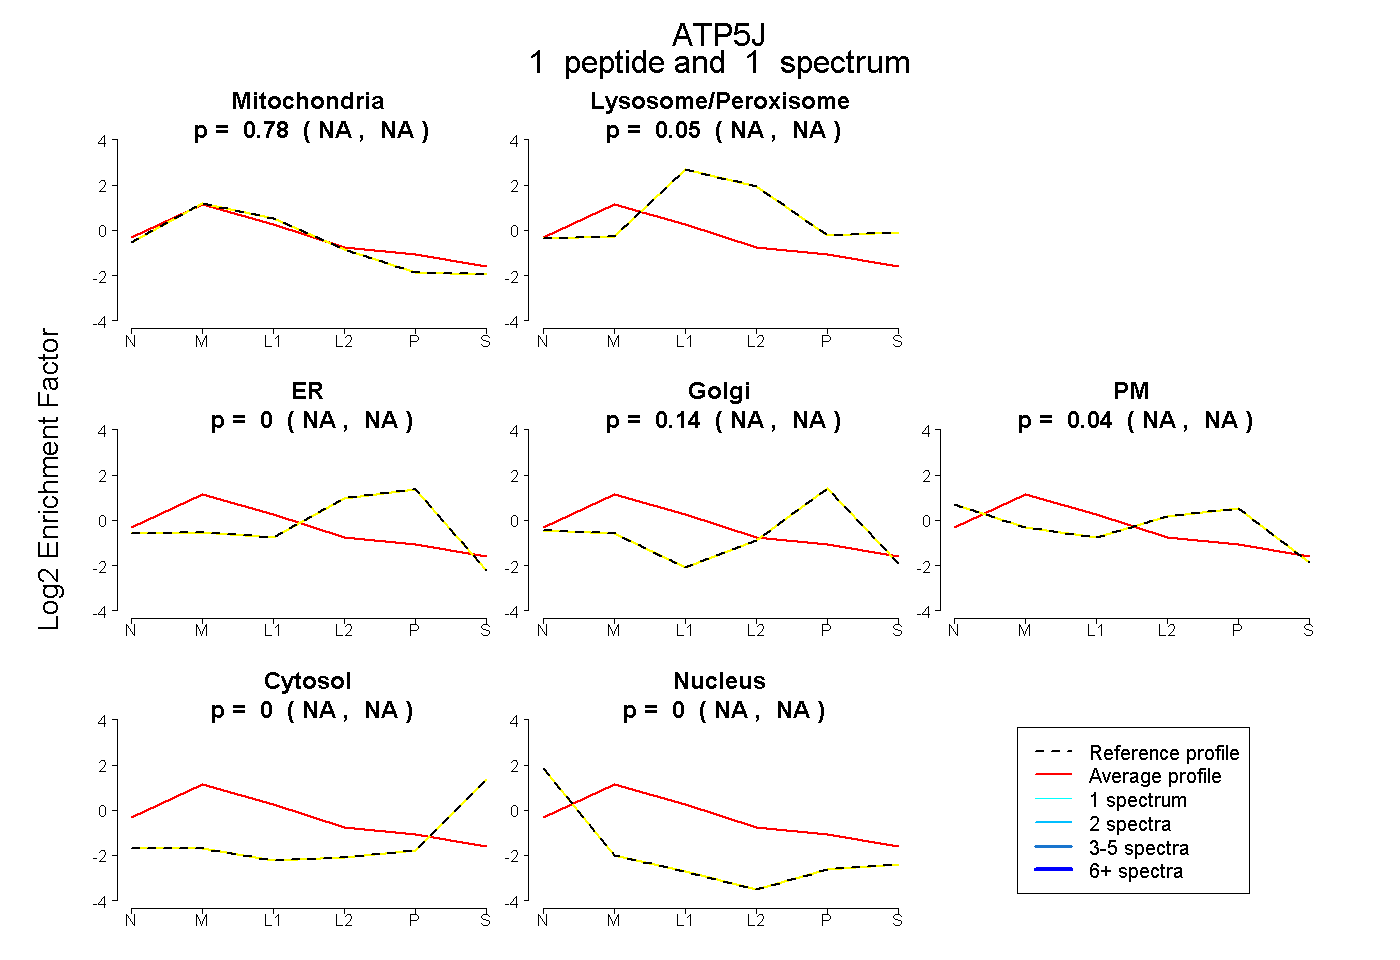
NA | NA
NA | NA
NA | NA
NA | NA
NA | NA
NA | NA
NA | NA
3peptides
spectra
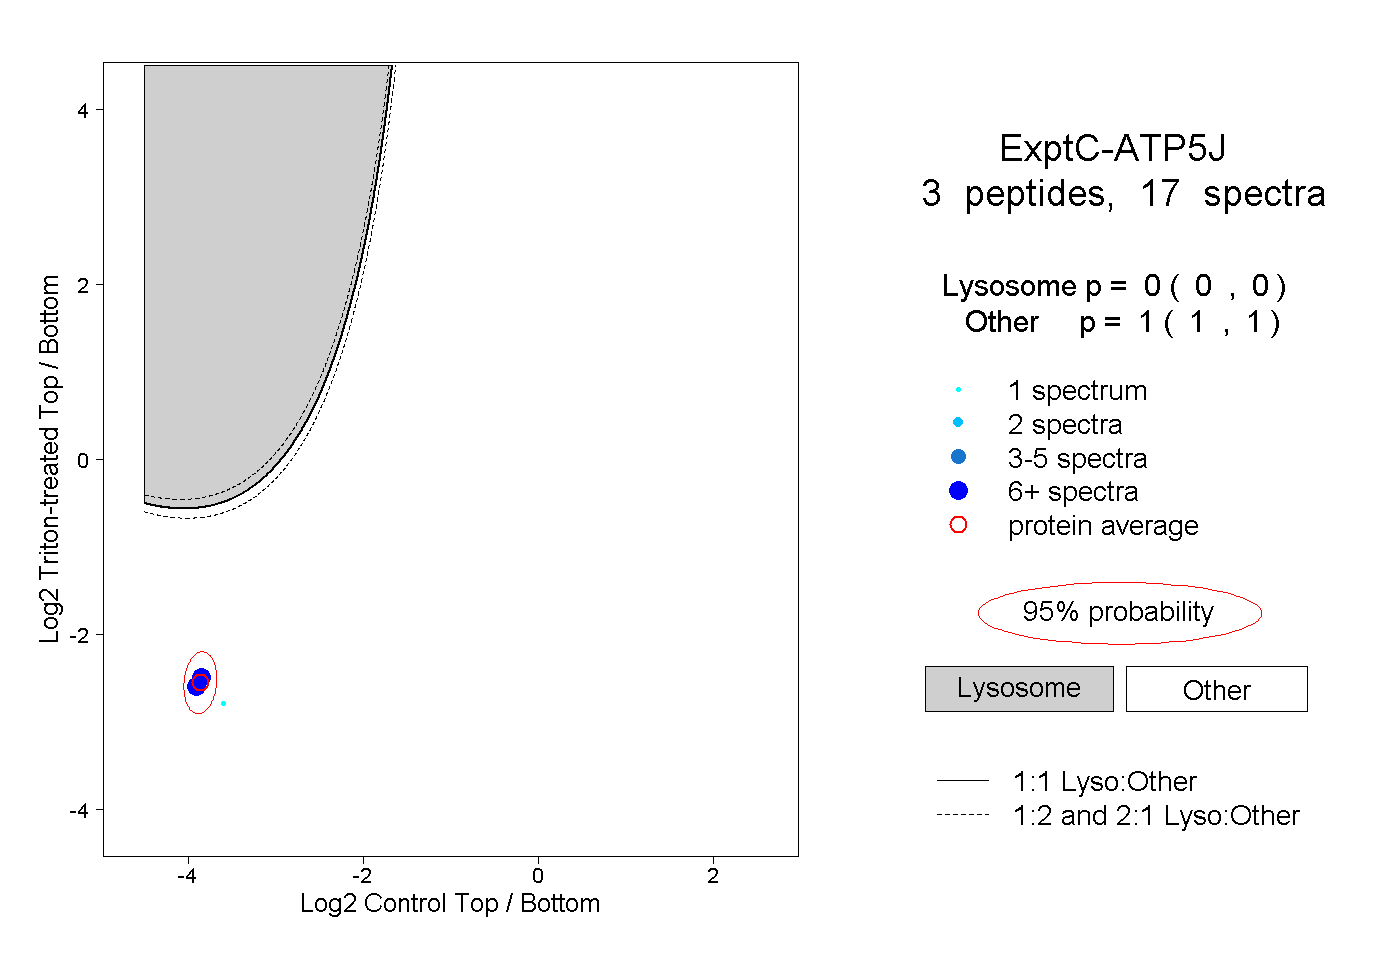
0.000 | 0.000
1.000 | 1.000
1peptide
spectra
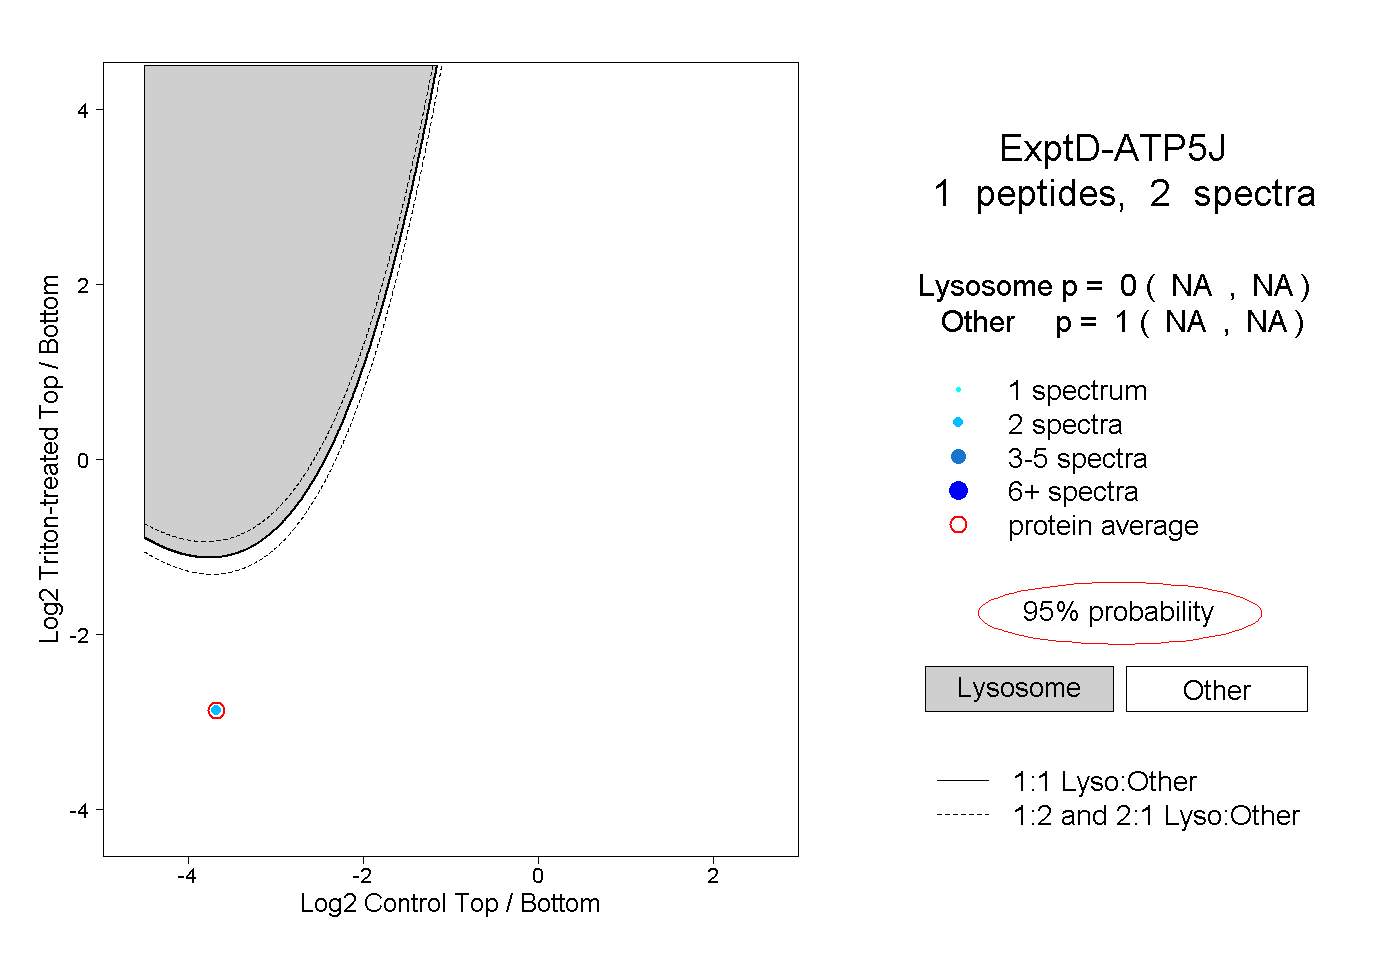
NA | NA
NA | NA