 3
3peptides
spectra
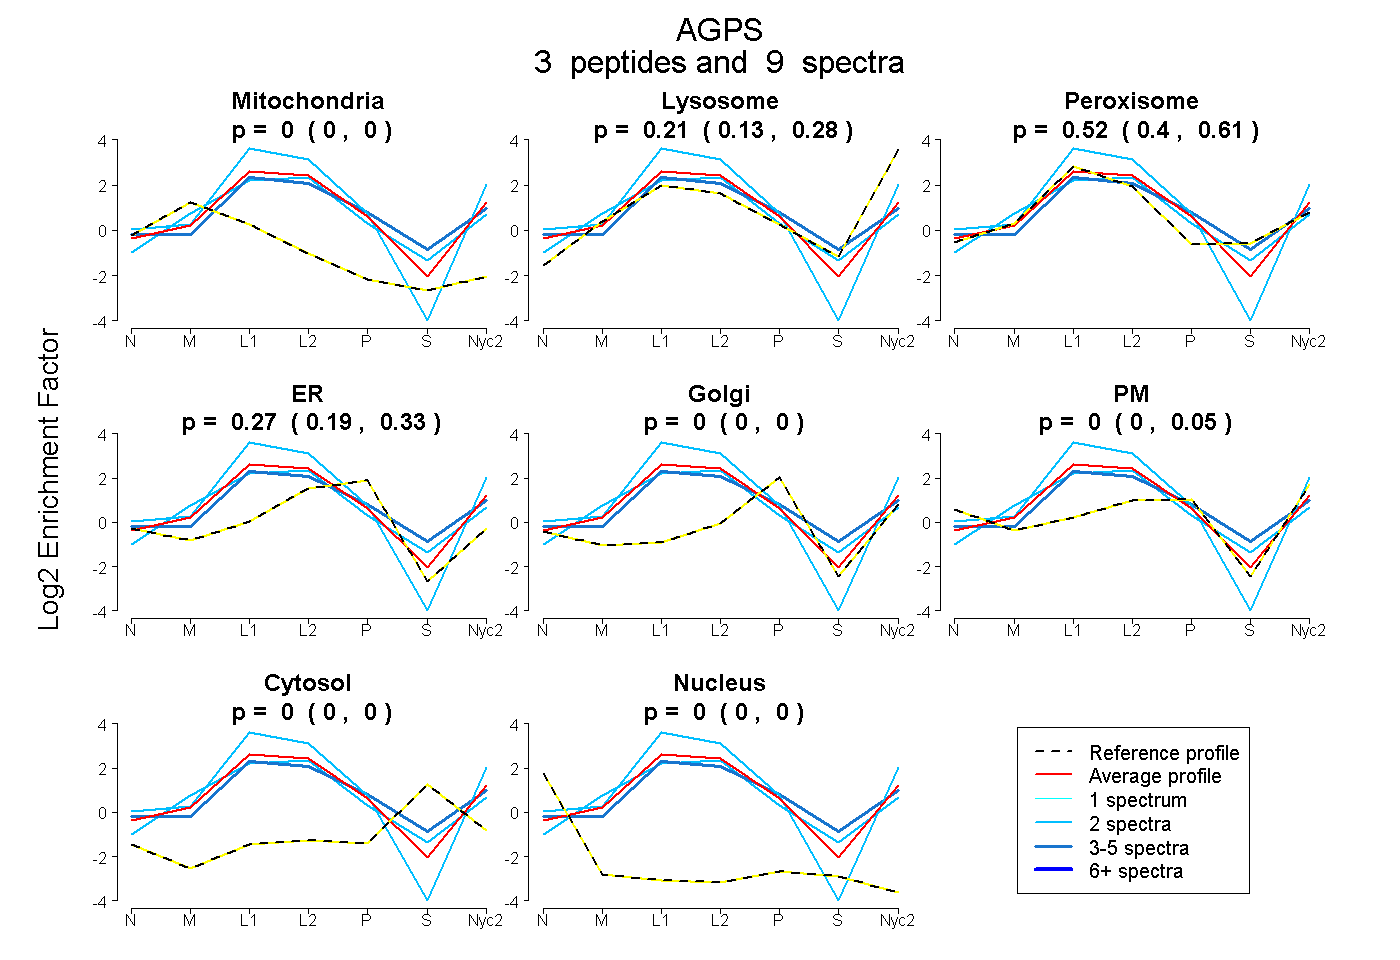
0.000 | 0.000
0.132 | 0.276
0.404 | 0.605
0.191 | 0.327
0.000 | 0.000
0.000 | 0.053
0.000 | 0.000
0.000 | 0.000
1peptide
spectrum
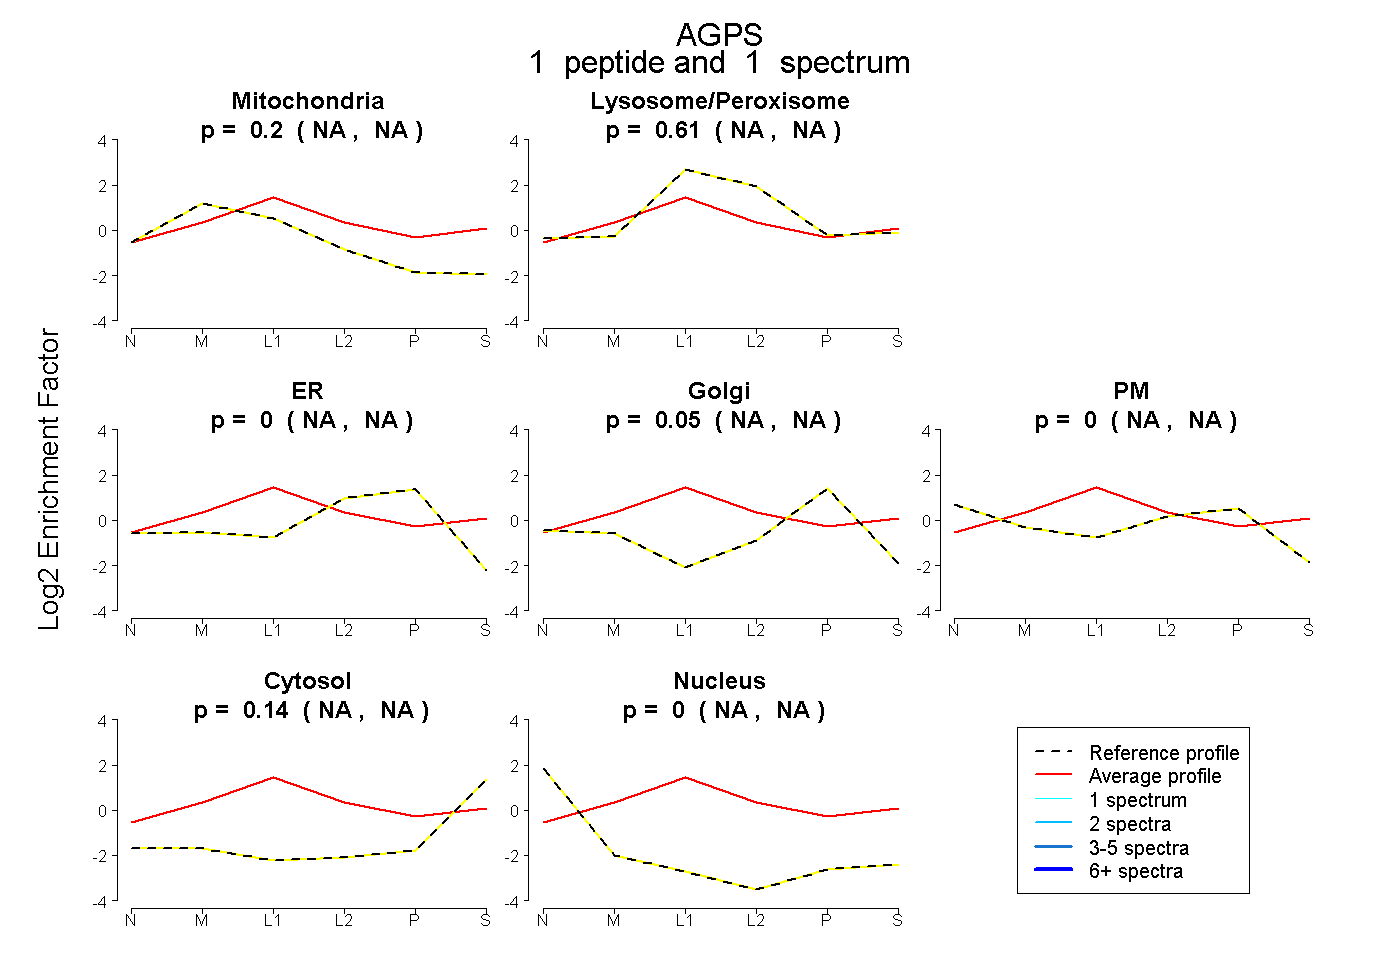
NA | NA
NA | NA
NA | NA
NA | NA
NA | NA
NA | NA
NA | NA
8peptides
spectra
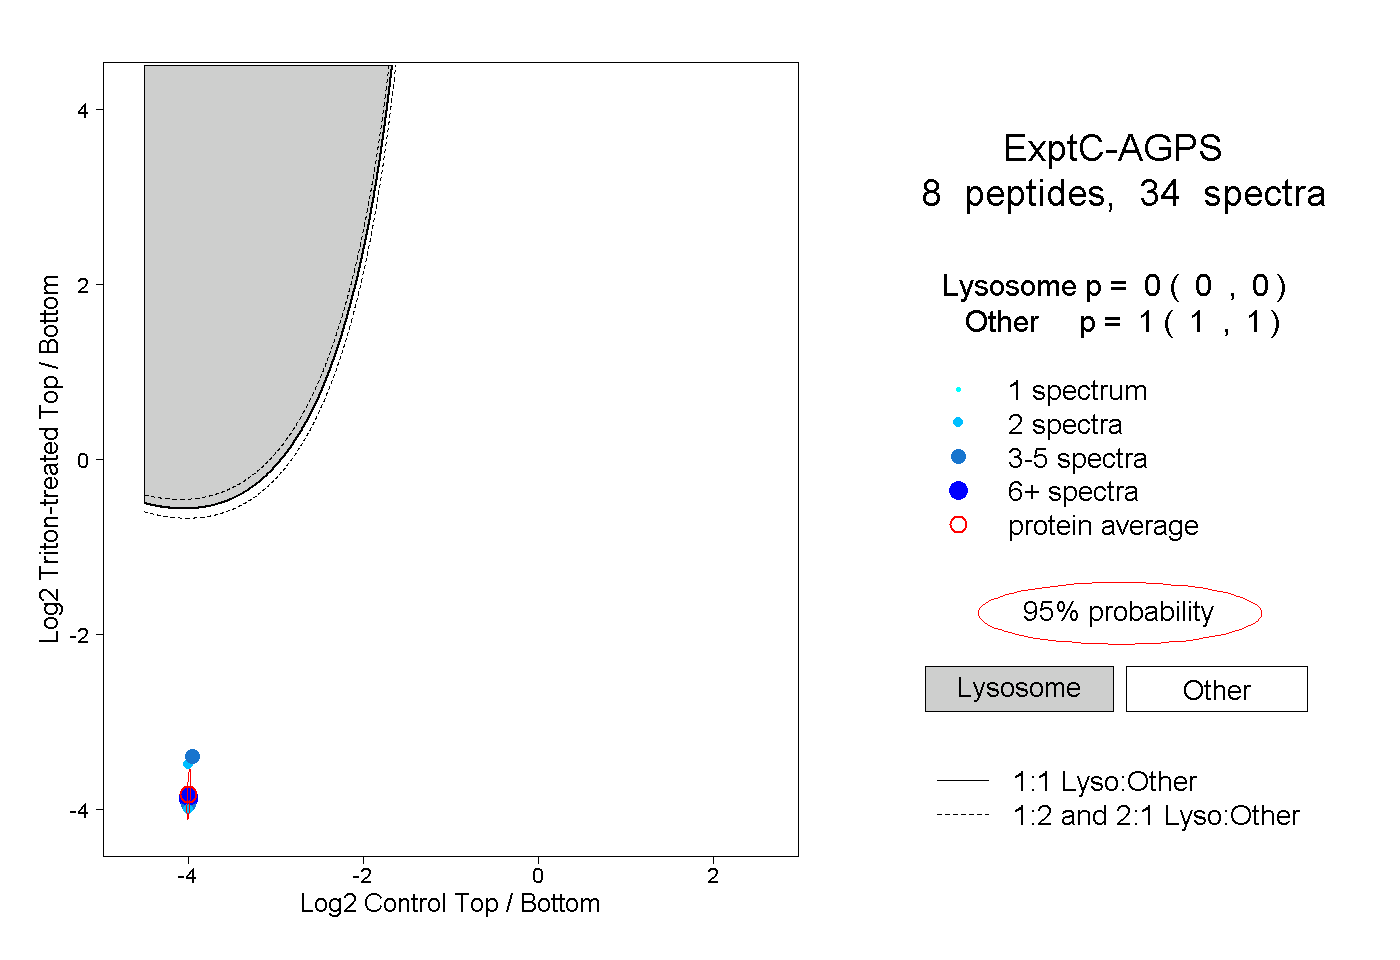
0.000 | 0.000
1.000 | 1.000
3peptides
spectra
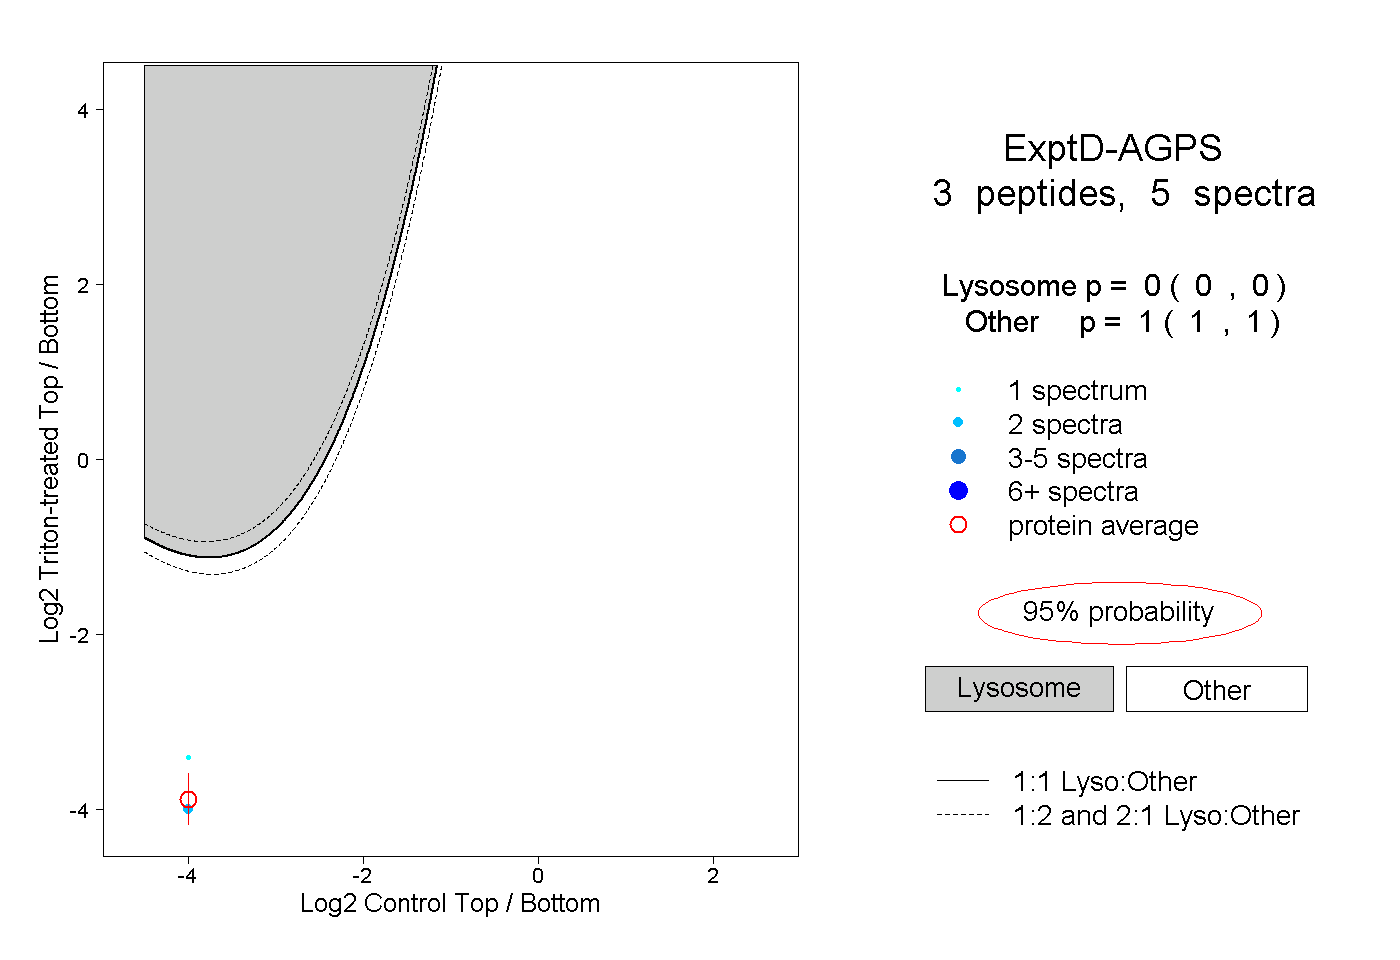
0.000 | 0.000
1.000 | 1.000