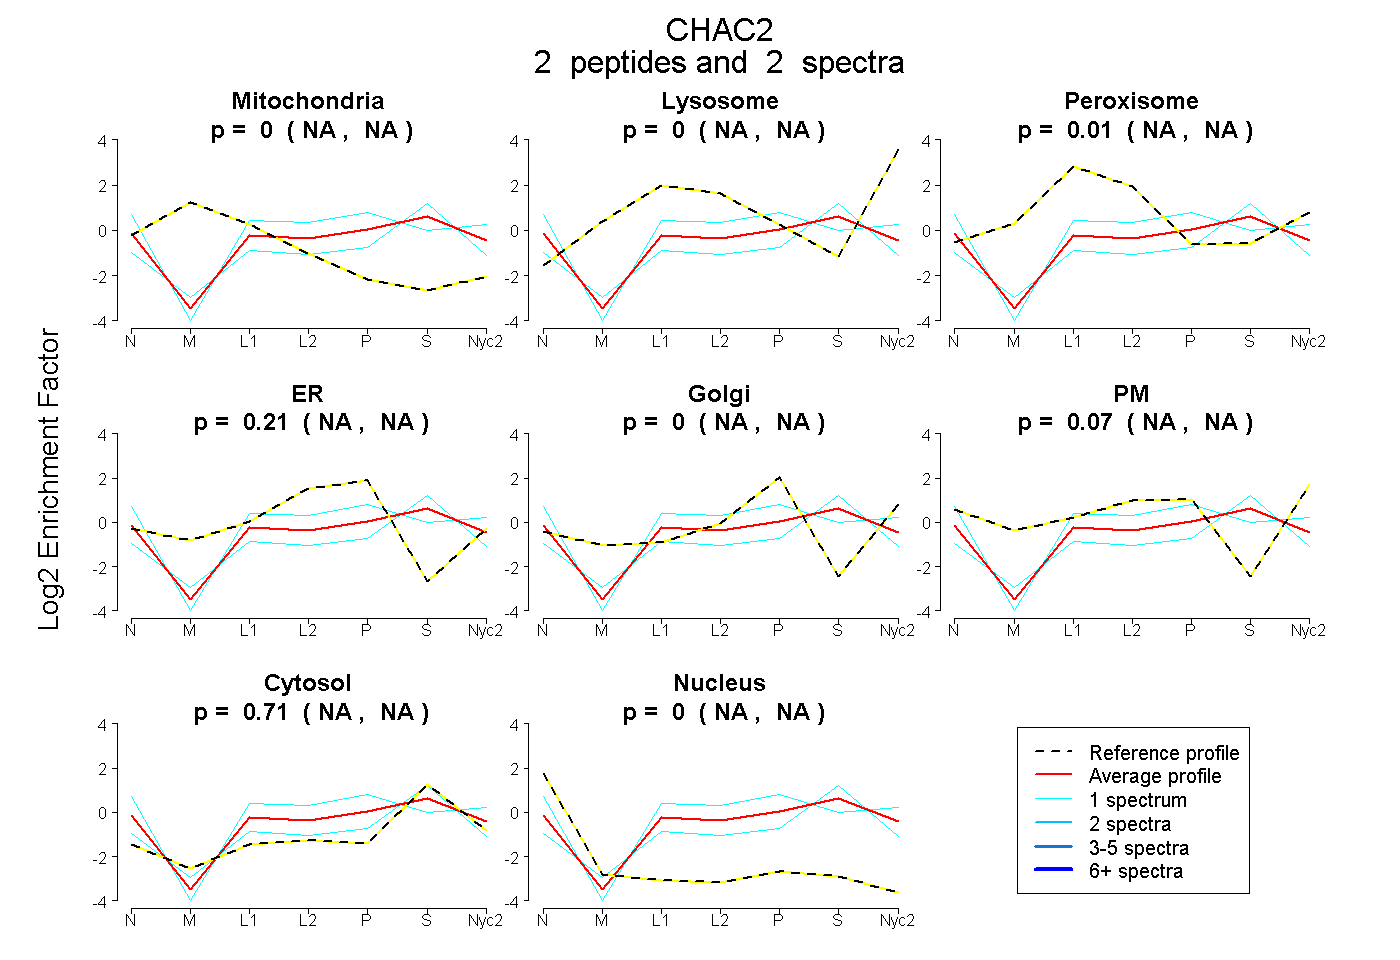
 2
2peptides
spectra
NA | NA
NA | NA
NA | NA
NA | NA
NA | NA
NA | NA
NA | NA
NA | NA
| Plot | Mito | Lyso | Perox | ER | Golgi | PM | Cytosol | Nucleus | |||||
| Expt A |
2 peptides |
2 spectra |
|
0.000 NA | NA |
0.000 NA | NA |
0.006 NA | NA |
0.212 NA | NA |
0.000 NA | NA |
0.072 NA | NA |
0.710 NA | NA |
0.000 NA | NA |
| 1 spectrum, GVPGKPGR | 0.000 | 0.000 | 0.000 | 0.084 | 0.000 | 0.000 | 0.916 | 0.000 | ||
| 1 spectrum, NTEYLFELADSIR | 0.000 | 0.000 | 0.000 | 0.218 | 0.000 | 0.282 | 0.500 | 0.000 |
| Plot | Lyso | Other | |||||||||||
| Expt C |
3 peptides |
5 spectra |
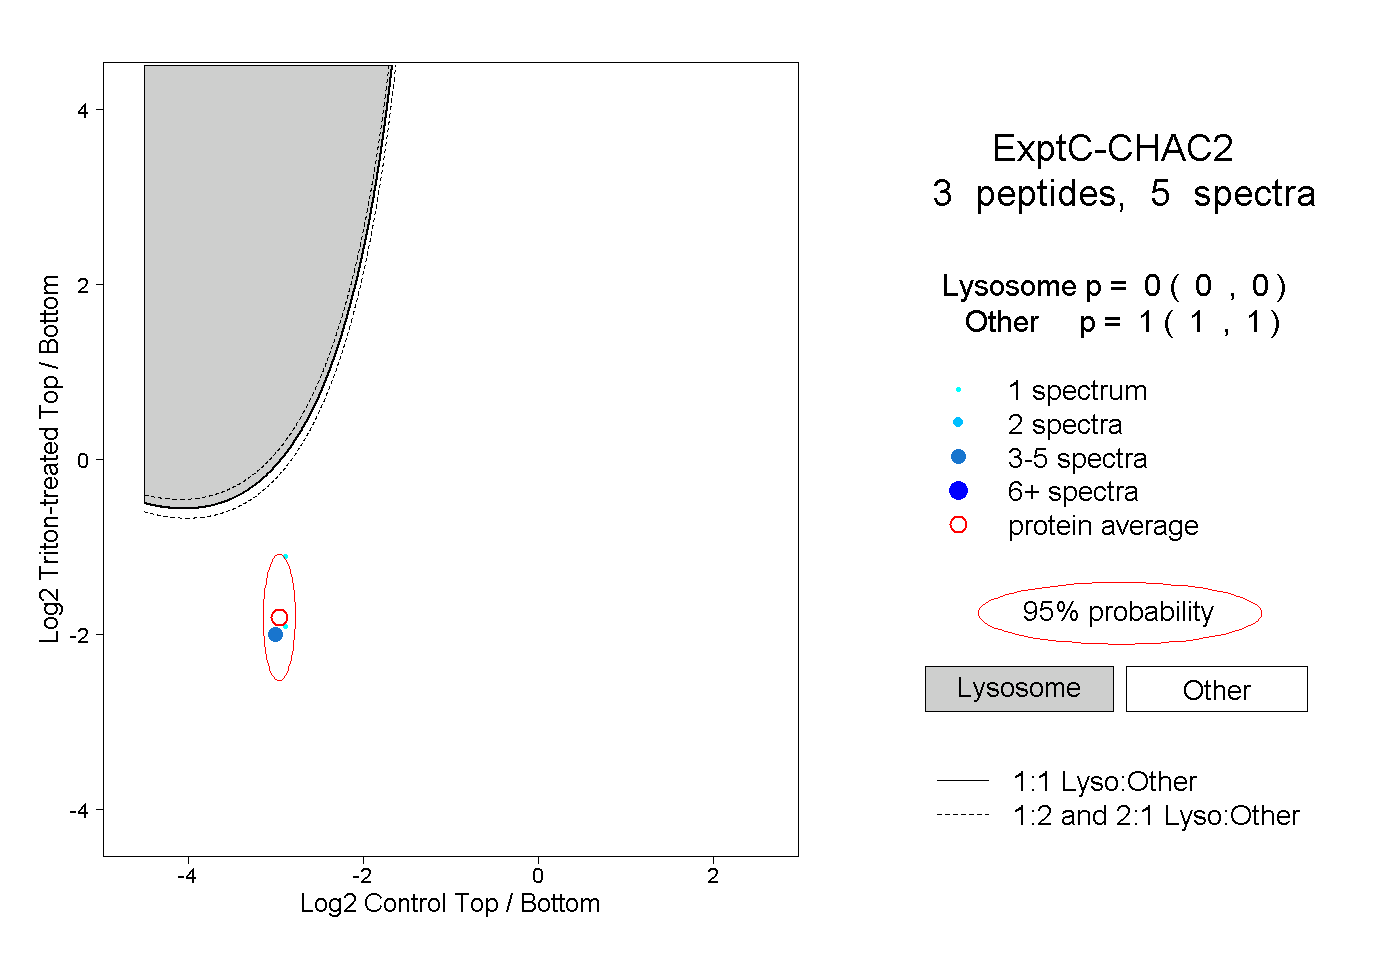 |
0.000 0.000 | 0.000 |
1.000 1.000 | 1.000 |