 3
3peptides
spectra
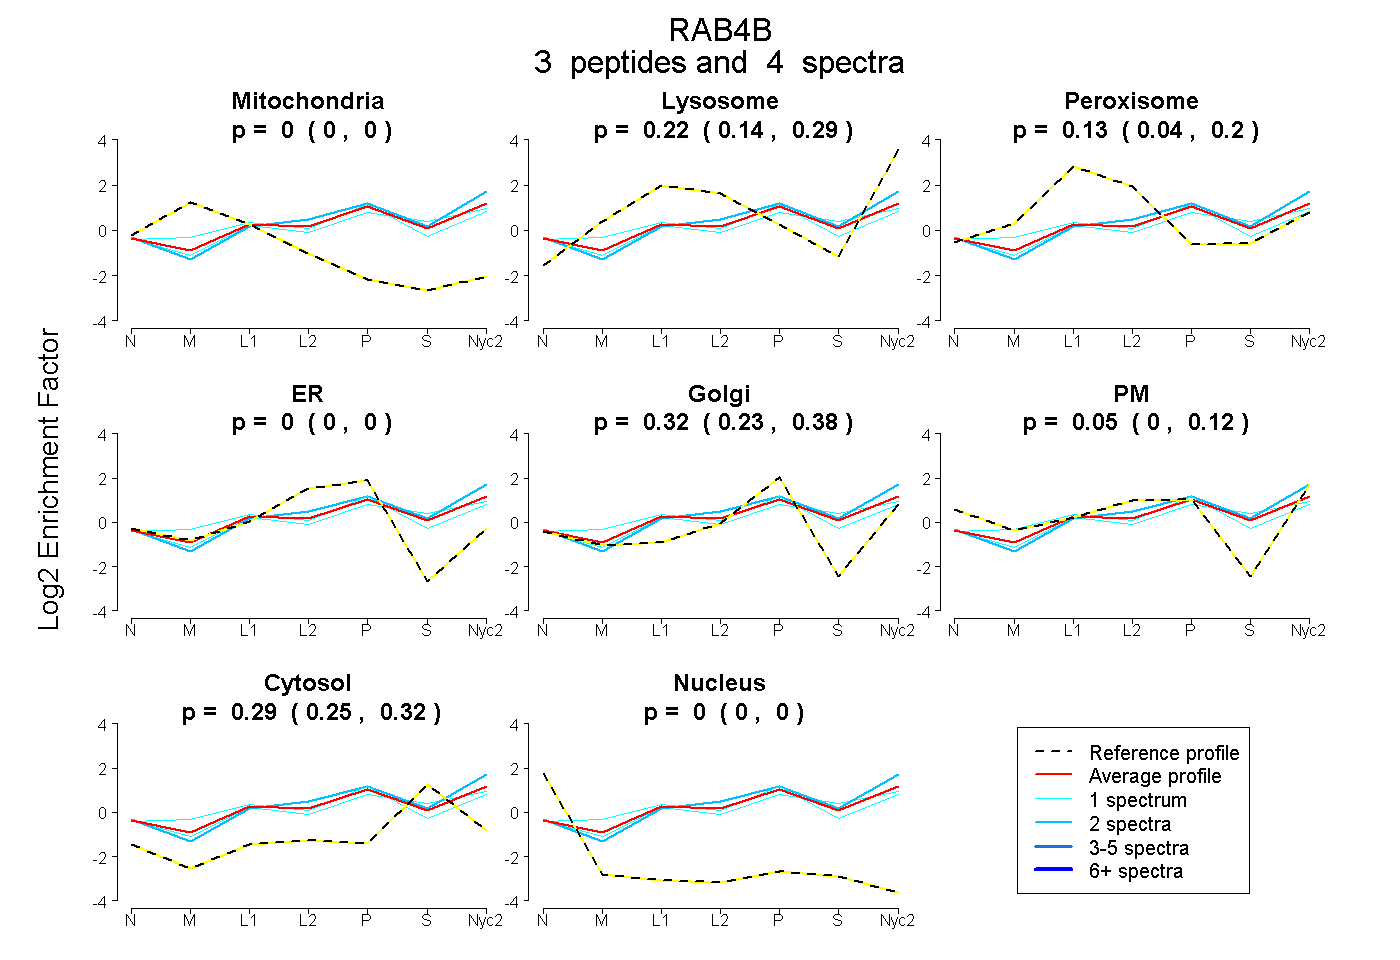
0.000 | 0.000
0.139 | 0.288
0.037 | 0.199
0.000 | 0.000
0.227 | 0.379
0.000 | 0.121
0.253 | 0.315
0.000 | 0.000
1peptide
spectra
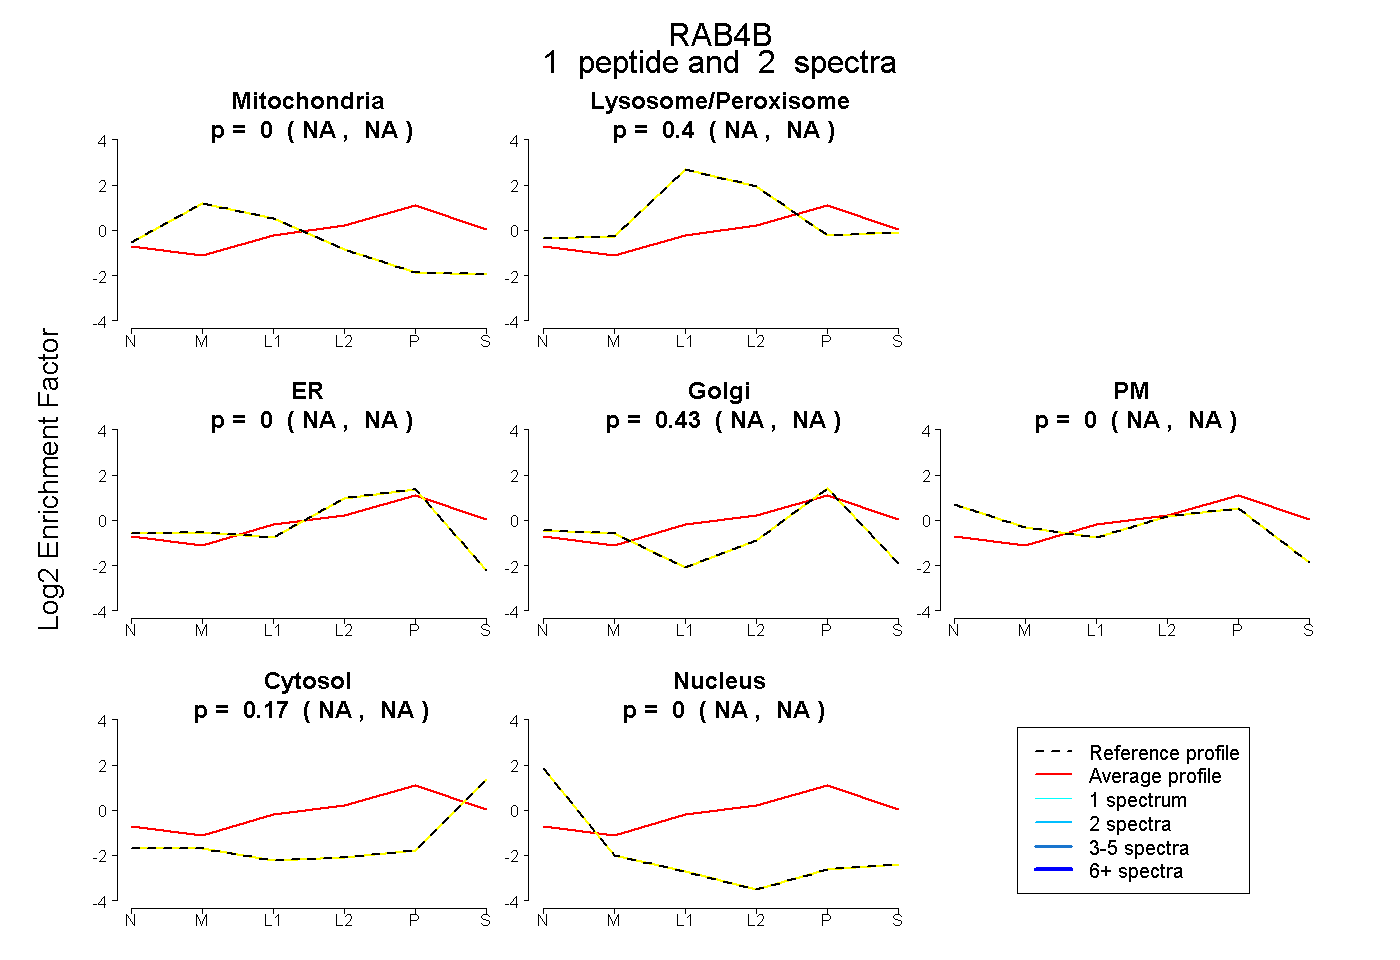
NA | NA
NA | NA
NA | NA
NA | NA
NA | NA
NA | NA
NA | NA
5peptides
spectra
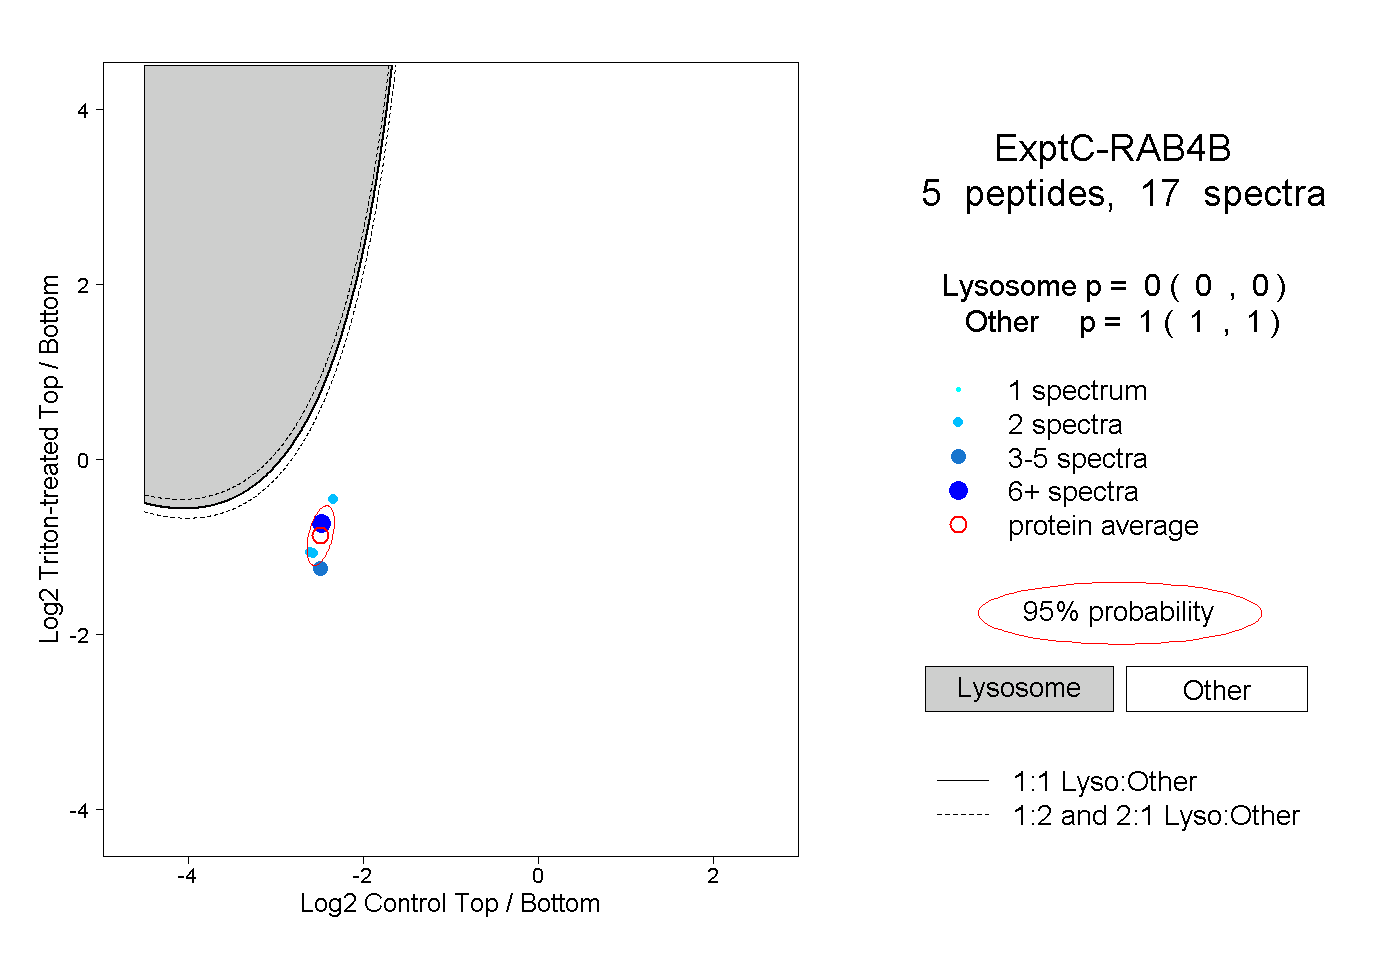
0.000 | 0.000
1.000 | 1.000
1peptide
spectrum
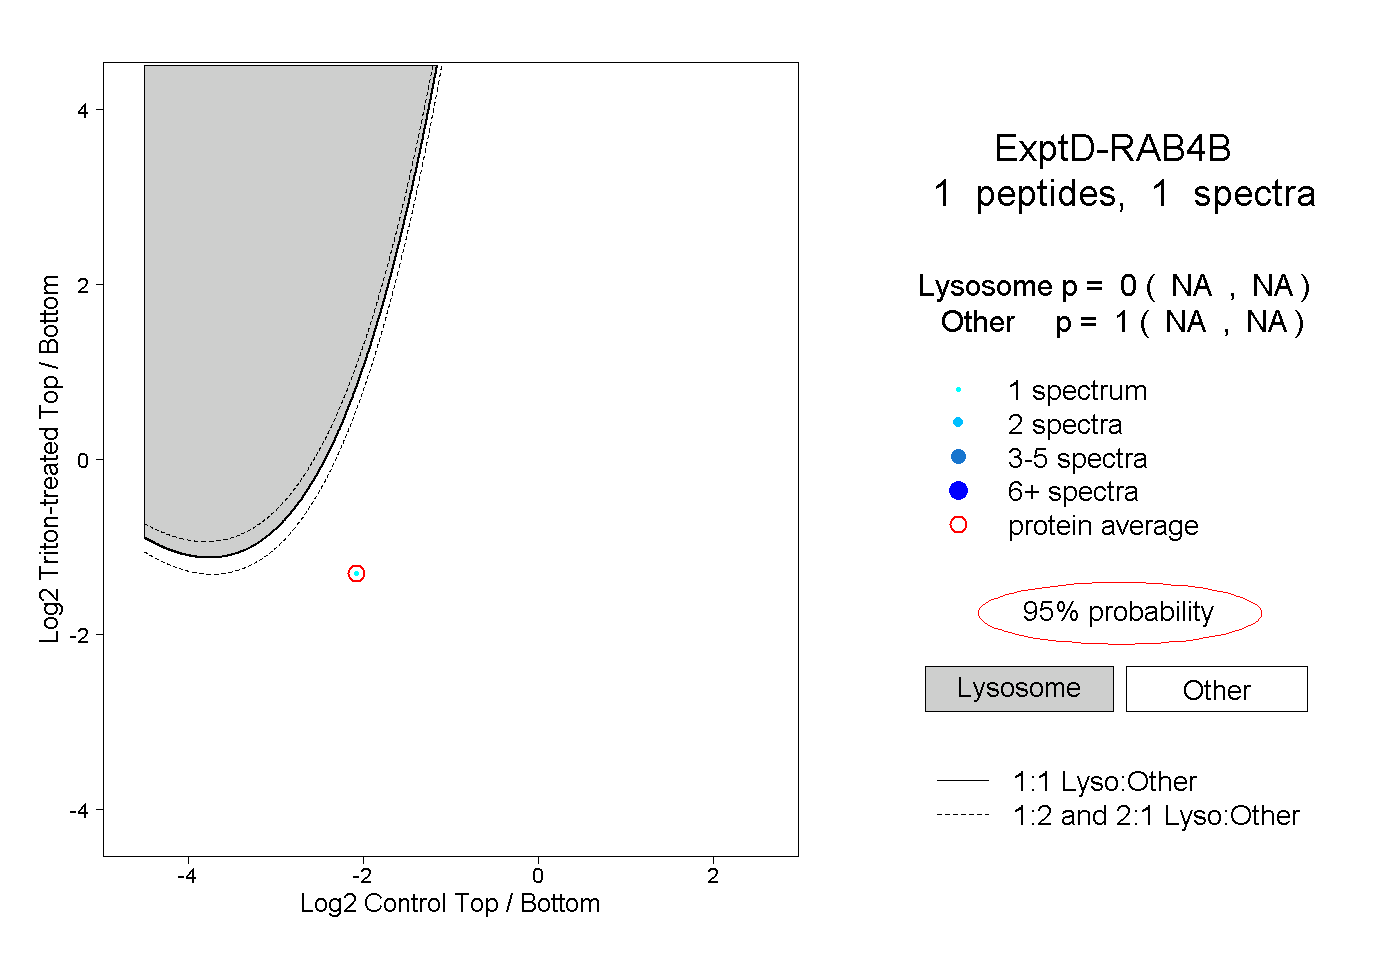
NA | NA
NA | NA